
Even after the weaker USD price-action, which generally has a beneficial impact on the SOL/USD pair, the SOL/USD coin pair failed to put a stop to
Even after the weaker USD price-action, which generally has a beneficial impact on the SOL/USD pair, the SOL/USD coin pair failed to put a stop to the downward moves of early in the day. The SOL/USD price picked up some more offers around the $160.00 mark, during the Asian trading session. Engineers have been unable to swiftly remedy this issue, resulting in transactions on the Solana blockchain failing to process blocks. As a result, Solana coin came under some downward pressure.
The recent buying bias in the crypto market has played a significant role in limiting future losses for the SOL/USD currency pair. The SOL/USD is now trading at about $161.797, and in the previous twenty-four hours, Solana has lost 2.69 percent.
The losses in the SOL/USD coin pair, on the other hand, could be brief or short-lived, as the weaker US dollar is helping to limit deeper losses in the SOL/USD. The broad-based greenback went sour ahead of the European session, after failing to extend its positive early-day gains.
As the latest US inflation data increases concerns that the Federal Reserve will begin asset cutting in 2021, the dollar remained within tight bands. As a result, the current losses in the US dollar have failed to provide any major support to the SOL/USD coin pair, at least for the time being.
The SOL/USD pair, on the other hand, may benefit from recent bullish movements in the crypto market. This began when the BTC price began to rise above the $46,000 resistance level versus the US Dollar. The BTC has risen above $47,000, although it is still encountering resistance near $47,600. The Bitcoin/USD exchange rate remains far above $45,000. As a result, BTC has begun a new upward trend above the $46,000 resistance level and the 100 hourly simple moving average.
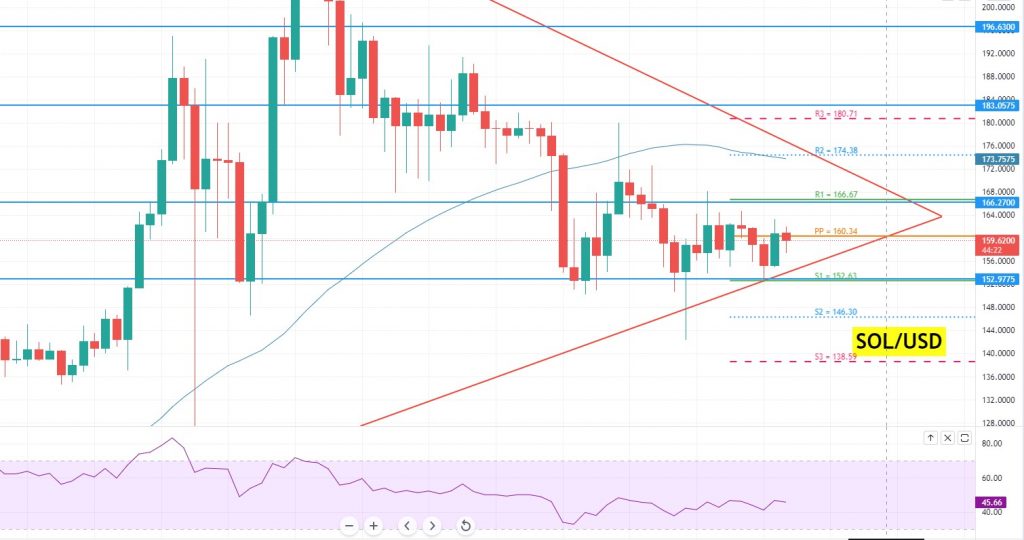
SOL/USD Technical Outlook
www.fxleaders.com