
S&P 500, Nasdaq 100, Dow Jones Talking Points:Stocks continue to rally and the Nasdaq 100 is now flirting with ‘bull market’ territory. This rall
S&P 500, Nasdaq 100, Dow Jones Talking Points:
- Stocks continue to rally and the Nasdaq 100 is now flirting with ‘bull market’ territory.
- This rally from the June lows already has many declaring that the bottom is in. This point of view is also usually entangled with the expectation that inflation has topped and the Fed is nearing a pivot.
- The analysis contained in article relies on price action and chart formations. To learn more about price action or chart patterns, check out our DailyFX Education section.
Stocks have been rallying like it’s April of 2020 and the Nasdaq 100 came into the morning flirting with ‘bull market’ territory after jumping by more than 20% from the June low. This, of course, is happening as many are questioning the possibility of recession while the Fed continues to hike rates with aim of tempering inflation.
And that’s where the proverbial rubber meets the road: Going off of prior patterns around the Fed, in which softness and accommodation were the answer for weakening economic data, some market participants are hypothesizing that the Fed is done with hikes or at least near a point of being done. And this has led into eventual cuts starting to get priced-in, which has helped equities to recover from the back-breaking sell-off that had gripped global markets coming into the month of June.
So, the argument at this point seems to boil down to whether or not the Fed has hiked enough to make a meaningful impact to inflation. And while many seem to already have an answer to this question the reality is that we simply don’t yet know as it takes time for rate hikes to transmit into the economy, a quote that even Chair Powell had offered up at the last FOMC press conference.
Those looking for or expecting a closer Fed pivot point to falling Treasury yields as a sign of that theme getting priced-in. The other side of the argument points to those same yields as a highlight of recessionary potential, which is accompanied with an argument supported by deeper and deeper inversion of the 2/10 Treasury spread.
What is undeniable nor up for debate, however, is the response in stocks after the most recent FOMC rate decision. The S&P 500 has now gained as much as 6.64% from the low set the day ahead of last week’s rate hike. This has propelled the index up to a fresh two-month-high and beyond a number of resistance levels. This is all continuation of a reversal that built with a falling wedge formation, and that continuation has now led to a bounce of up to 14.59% from the June low.
S&P 500 Daily Chart
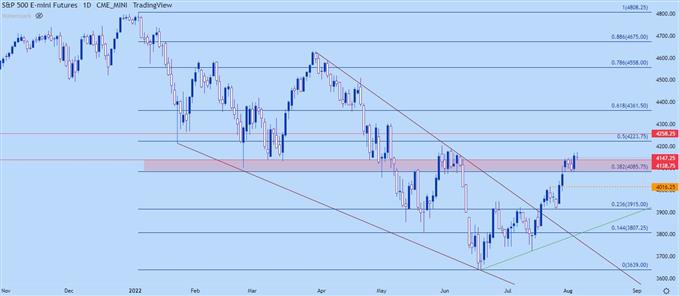
Chart prepared by James Stanley; S&P 500 on Tradingview
S&P 500 Shorter-Term
At this point the S&P 500 is holding above a key spot of prior support-turned-resistance on the chart. This spans from a Fibonacci level at 4085 up to a prior price action swing at 4138.
This zone built a range that held from last Thursday into yesterday’s trade, with a breakout finally showing up early in yesterday’s session.
Bulls haven’t shown much continuation since, but there has been a show of support at prior resistance, which keeps the door open to bullish continuation given the series of higher-highs and possible higher-low.
For bears, at this point, a breach of 4085 would start to re-open that door as that level caught a number of inflections before the breakout took-hold.
S&P 500 Four-Hour Chart
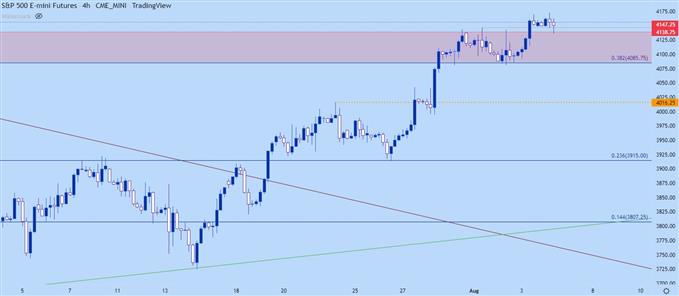
Chart prepared by James Stanley; S&P 500 on Tradingview
Nasdaq 100
Nasdaq futures closed yesterday with a 19.9% gain from the June low. During the session, the move had run as high as a 20.25% move. And, depending on how you draw trendlines, there may or may not have been a key resistance inflection. And the reason for that subjectivity is the messiness that had showed in the Nasdaq around the Q1 close and Q2 open.
If establishing the trendline to the April 5 high, the trendline has no breaches and all price action is contained therein. However, if using the March 30 high, which also catches follow-through resistance on April 5, then that trendline just came into play this morning and is producing a pullback at this early-stage.
Nasdaq 100 Daily Price Chart
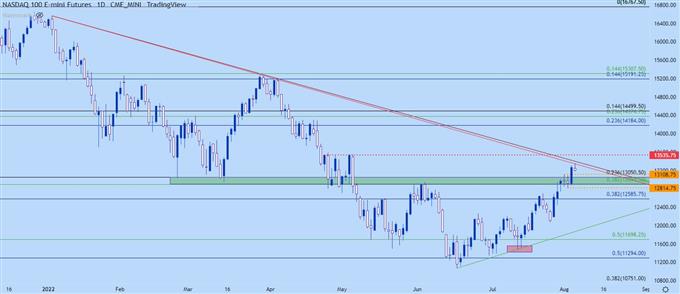
Chart prepared by James Stanley; Nasdaq 100 on Tradingview
Nasdaq shorter-term
The Nasdaq showed similar ranging action along with the S&P 500 although on my chart, it doesn’t appear as clean. Prices are pulling back from the trendline re-test and there’s a point of possible price action support around prior range resistance, around 13,108. There’s a Fibonacci level at 13,050 and another at 12,894 before range support comes into the picture at 12,814.
If it seems like that’s a lot of possible levels – it is – but, it also highlights how the move has become a bit ‘jumpier’ over the past few days as the macro theme of inflation and FOMC policy is getting so much attention.
Nasdaq four-hour chart
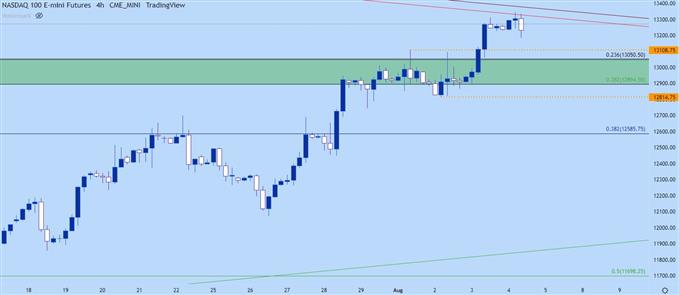
Chart prepared by James Stanley; Nasdaq 100 on Tradingview
Nasdaq ‘Bear Market Bounces’
With the Nasdaq flirting with bull market territory and many declaring that the bottom is in, some historical context could be helpful.
On March 14th of 2008 Bear Sterns received a rescue package from the Fed that led to its eventual sale to JP Morgan. The index had fallen by as much as 26% from the high that was set the prior November. The rescue package helped to mark a short-term bottom, after which stocks rallied by 23% into the June open.
But, all was not well at the time. Lehman brothers was still a few months from their dissolution in September, and the Nasdaq then went on to drop another 50% after that top in June.
Now, this is one historical example. Does that mean that this will happen here? No, it’s one example, and an extreme one at that. But – this does highlight how market are constantly shifting, especially when the stakes get raised.
Nasdaq 100 November 2007 – March 2009
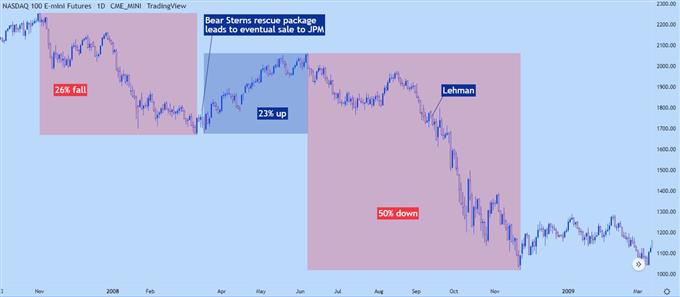
Chart prepared by James Stanley; Nasdaq 100 on Tradingview
Dow Jones
While both the S&P 500 and Nasdaq broke out yesterday – the Dow did not, and that remains in range with a hold at a really big spot of confluent support. That confluent support shows up around the 32,400 area and came back into the picture on Tuesday, which was followed by a strong bounce up to resistance yesterday.
Overhead is another point of possible resistance, plotted around 33,236, which is the same zone that helped to set the highs around the May/June period just before prices broke-down to a fresh two-year-low.
Outside of the near-term range, there may be a descending triangle brewing although that would still be in the early stage and would need to be accompanied by continued lower-highs.
Dow Jones Daily Chart
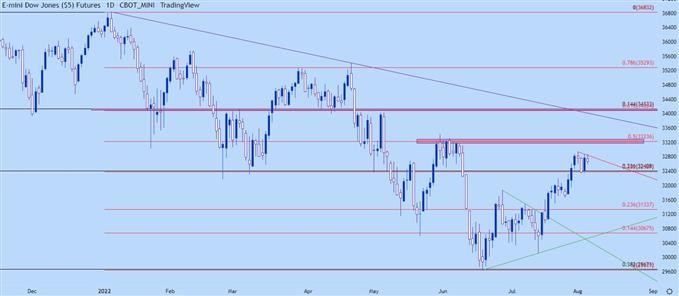
Chart prepared by James Stanley; Dow Jones on Tradingview
— Written by James Stanley, Senior Strategist, DailyFX.com & Head of DailyFX Education
Contact and follow James on Twitter: @JStanleyFX
element inside the
element. This is probably not what you meant to do!Load your application’s JavaScript bundle inside the element instead.
www.dailyfx.com