 Rebounds Sharply from Key Support Level — Is a Bullish Breakout Ahead?")
Konstantin Kaiser•Thursday, April 24, 2025•3 min read Add an article to your Reading ListRegister now to be able to add articles to y

Quick overview
- The S&P 500 (SPX) has rebounded 13.13% after a 21.35% correction, approaching a key Fibonacci resistance level.
- A death cross on the daily chart indicates a bearish trend, but bullish momentum is building as MACD shows positive signs.
- The index is testing critical resistance at the 50-period EMA on the 4-hour chart, with a breakout potentially leading to further gains.
- Despite short-term optimism, SPX remains in a broader three-month downtrend, with key support levels identified near the Golden Ratio.
S&P 500 (SPX) Prints Death Cross on Daily — But Bullish Momentum Builds Beneath the Surface
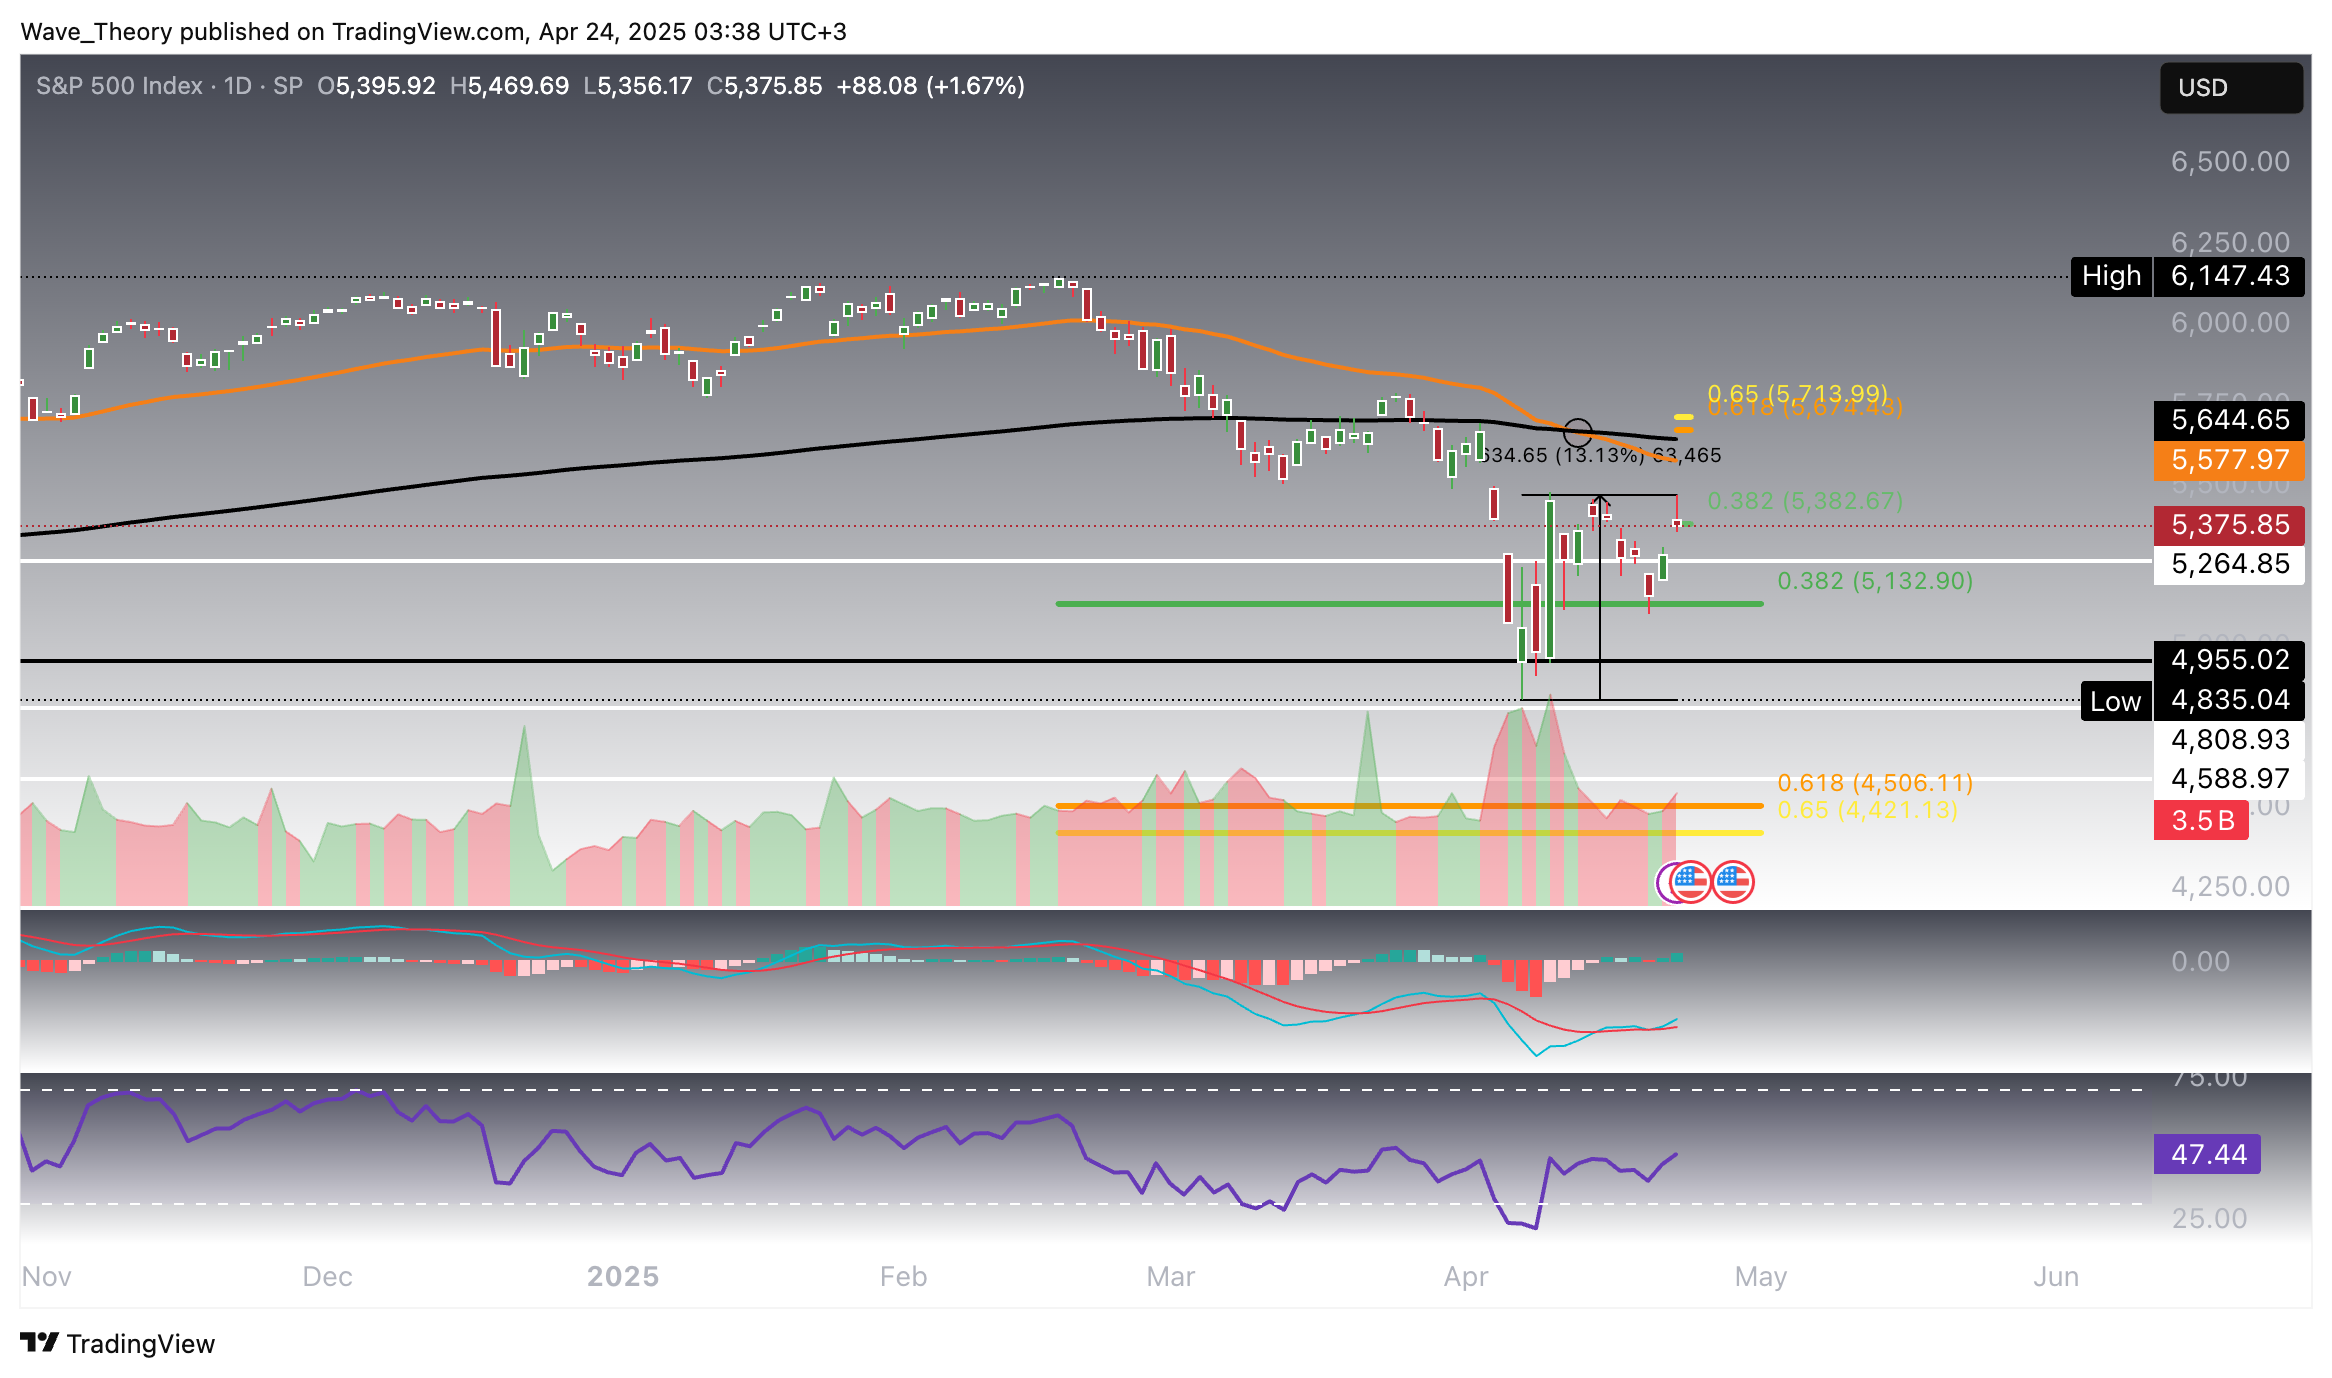
The S&P 500 (SPX) is currently presenting a complex technical setup, with mixed signals across key indicators on the daily chart. A death cross — where the 50-day EMA has crossed below the 200-day EMA — has now formed, confirming a bearish trend bias in the short- to medium-term outlook.
However, under the hood, bullish momentum is beginning to stir. The MACD lines have crossed to the upside, and the MACD histogram has printed two consecutive bullish ticks, indicating potential acceleration in positive momentum. In contrast, the RSI remains neutral, offering no clear directional bias at this stage.
From a price structure perspective, SPX recently bounced sharply off a major support zone between 4,589 and 4,809, marking a 13.13% rally off the lows. This move has now brought price action back to a key Fibonacci resistance level at 5,382.
A confirmed breakout above 5,382 could pave the way for a test of the Golden Ratio (0.618 Fib level) at 5,714 — a crucial inflection point. Only a sustained close above the 5,714 level would signal the end of the broader corrective phase. Should that occur, the index may reattempt its previous all-time high at 6,147, or potentially print new highs beyond that.
S&P500
S&P 500 (SPX) Confronts Key Resistance at 50-EMA on 4H Chart
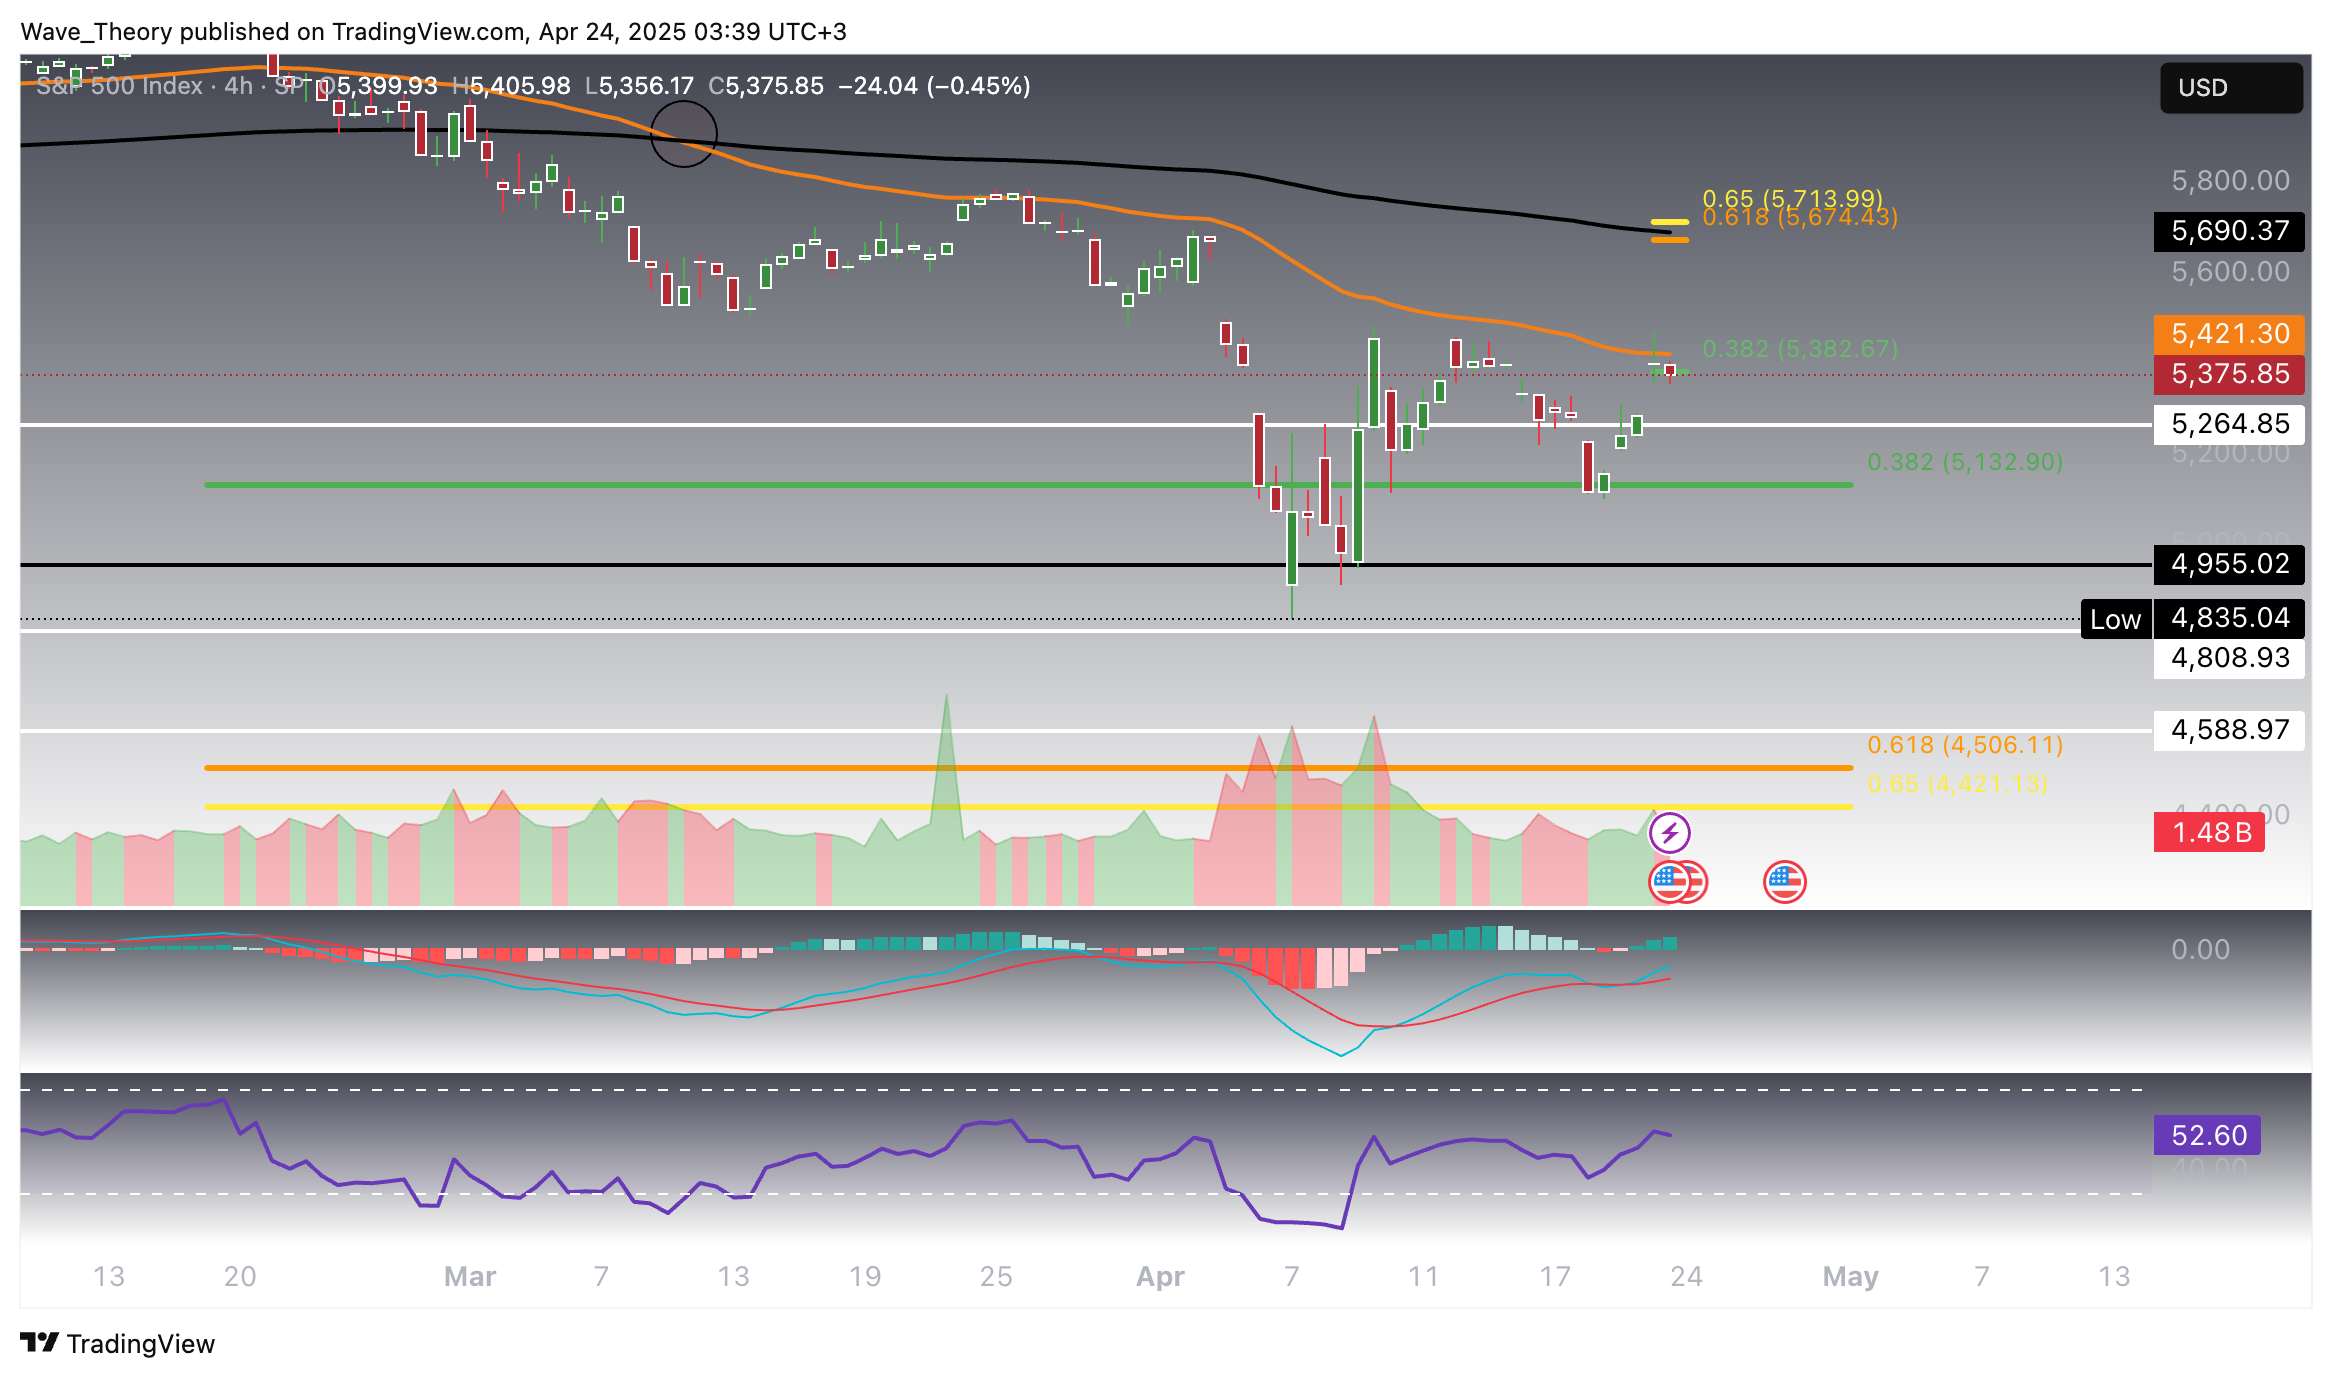
The S&P 500 (SPX) is currently testing critical resistance at the 50-period EMA on the 4-hour chart, located at 5,421. A decisive breakout above this level could open the door to the next major resistance area: the 200-period 4H EMA, which aligns with the Golden Ratio (0.618 Fibonacci level) around 5,714.
The short-term technical landscape on the 4H chart remains mixed. The exponential moving averages have formed a death cross, suggesting a bearish bias in the near term. However, momentum indicators are painting a different picture: the MACD lines are crossed bullishly, and the MACD histogram continues to build higher, signaling growing bullish momentum. Meanwhile, the RSI is tracking sideways in neutral territory, offering no clear directional signal for now.
As price action compresses between dynamic resistance and recent bullish momentum, the resolution of this setup could prove pivotal in defining the next leg for SPX.
Bullish MACD Histogram Suggests Building Momentum on Weekly Chart
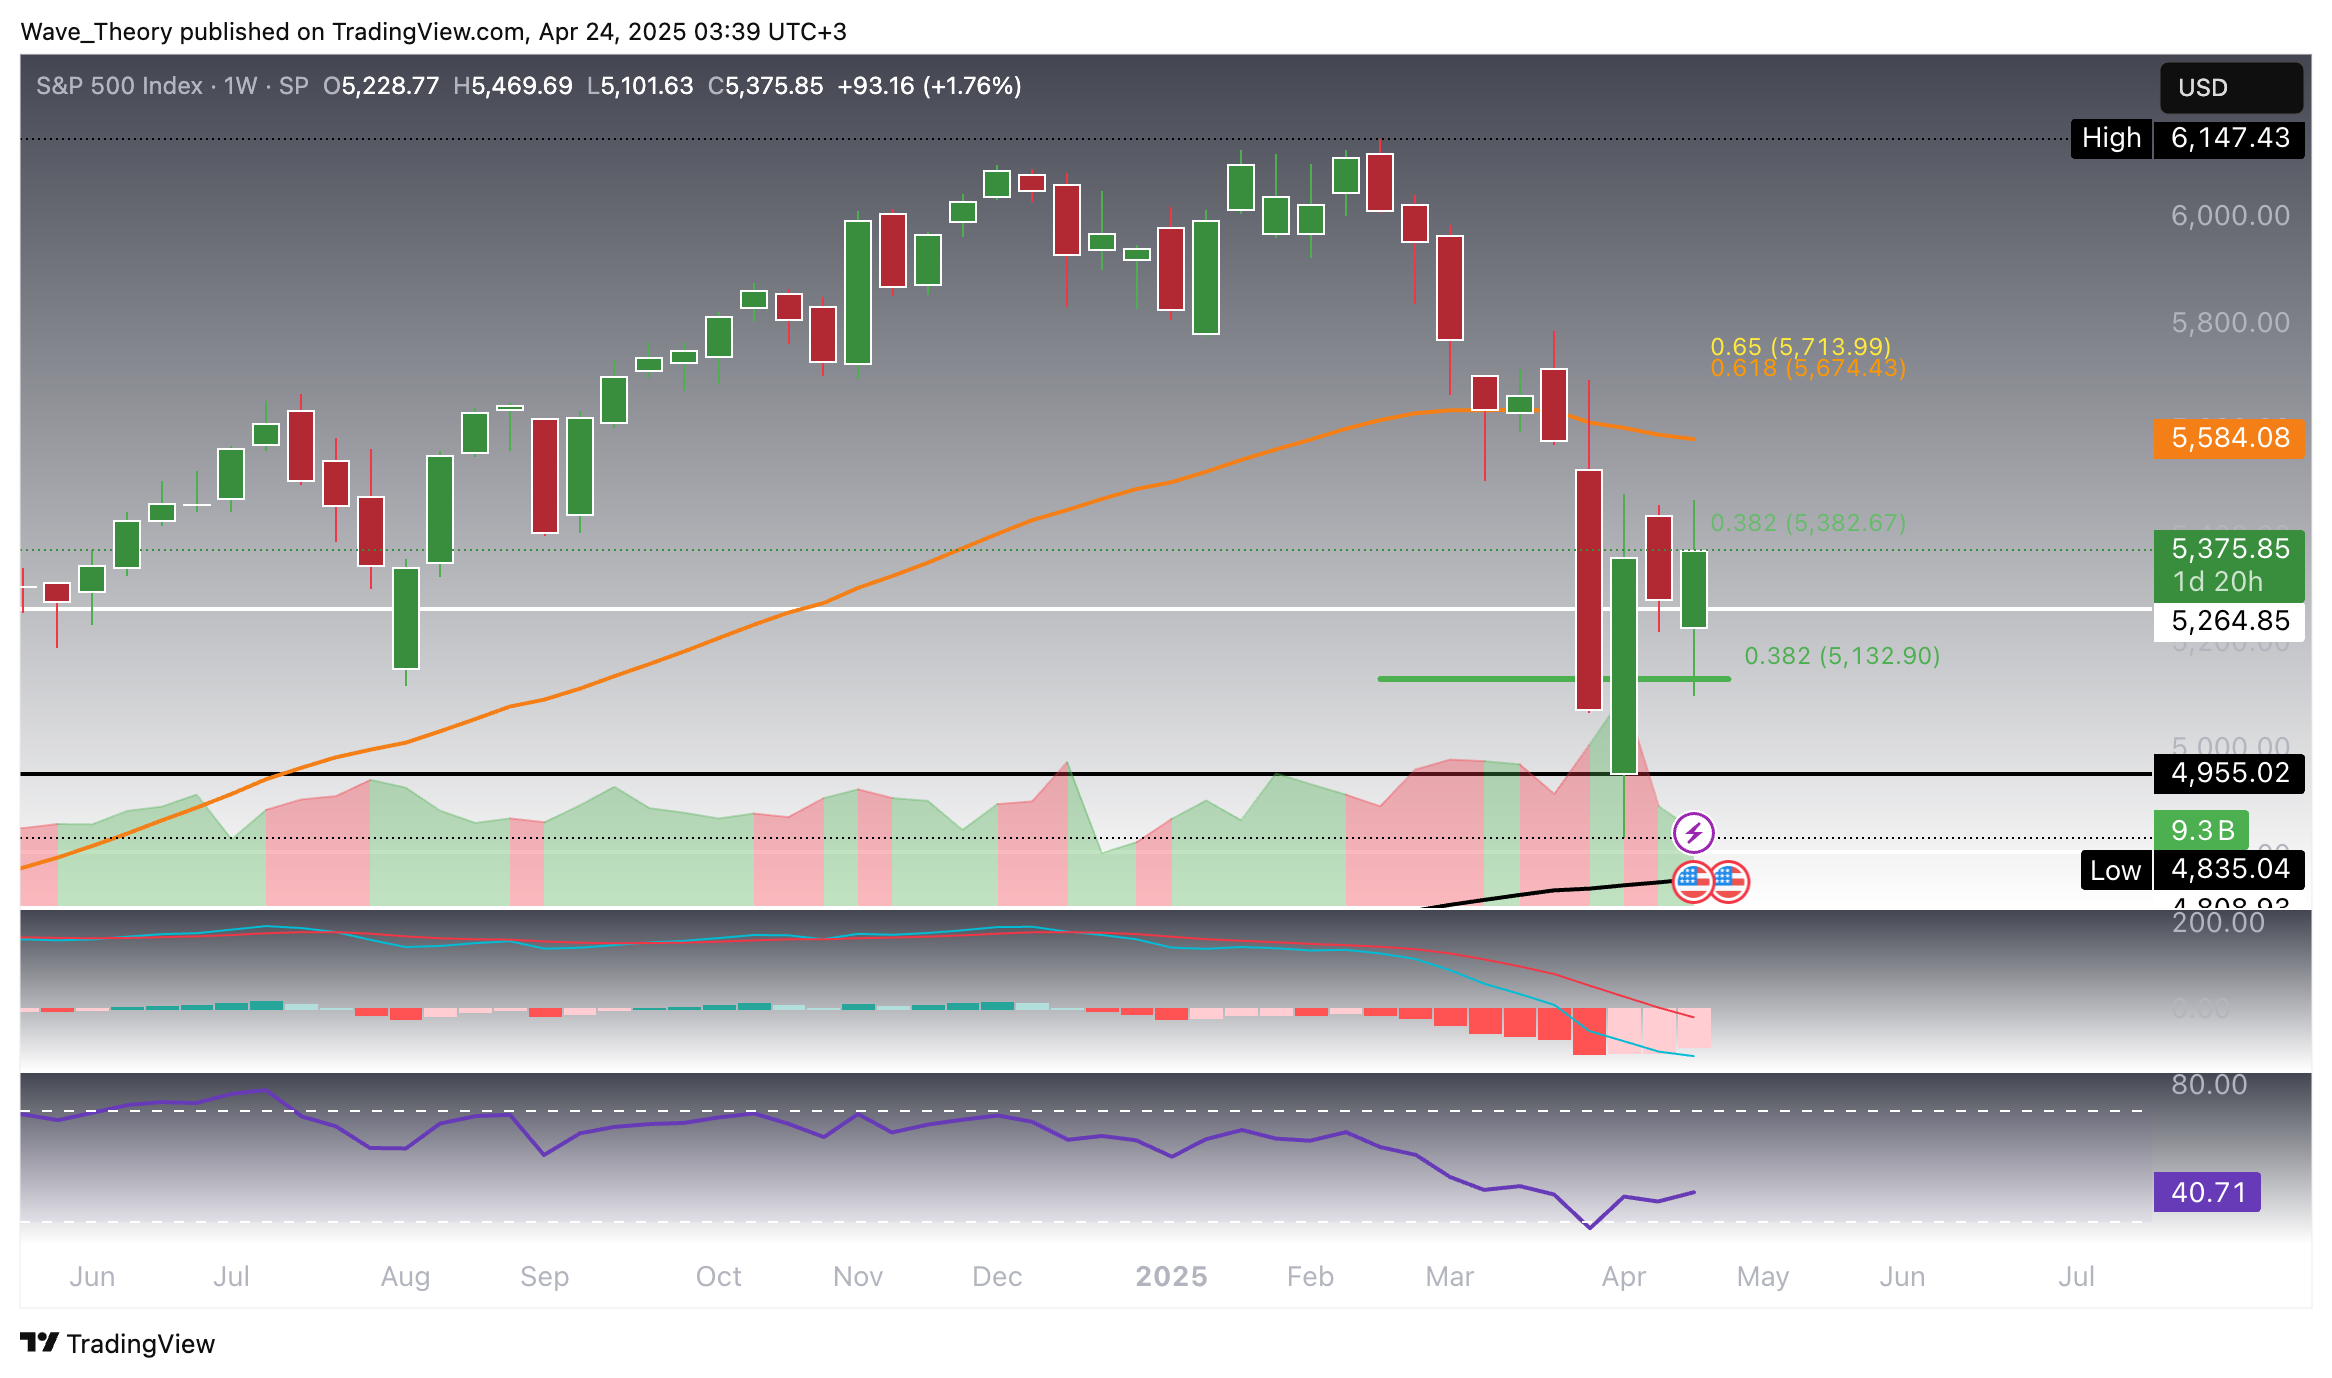
The S&P 500 (SPX) is beginning to show signs of potential mid-term strength on the weekly timeframe, as the MACD histogram has printed three consecutive bullish bars, indicating growing upside momentum beneath the surface.
Despite this constructive shift, signals remain mixed. While the MACD lines are still bearishly crossed, the exponential moving averages (EMAs) continue to display a golden cross, reinforcing a bullish trend bias over the medium term. At the same time, the RSI remains in neutral territory, providing no strong directional cue.
From a structural standpoint, should SPX clear its immediate resistance zone, it would next encounter a key technical ceiling at the 50-week EMA near 5,584. A breakout beyond that level would put the spotlight on the Golden Ratio resistance at 5,714, a level that could mark the end of the broader corrective phase and potentially reignite the larger uptrend.
S&P 500 (SPX) Remains in a Three-Month Downtrend Despite Short-Term Optimism
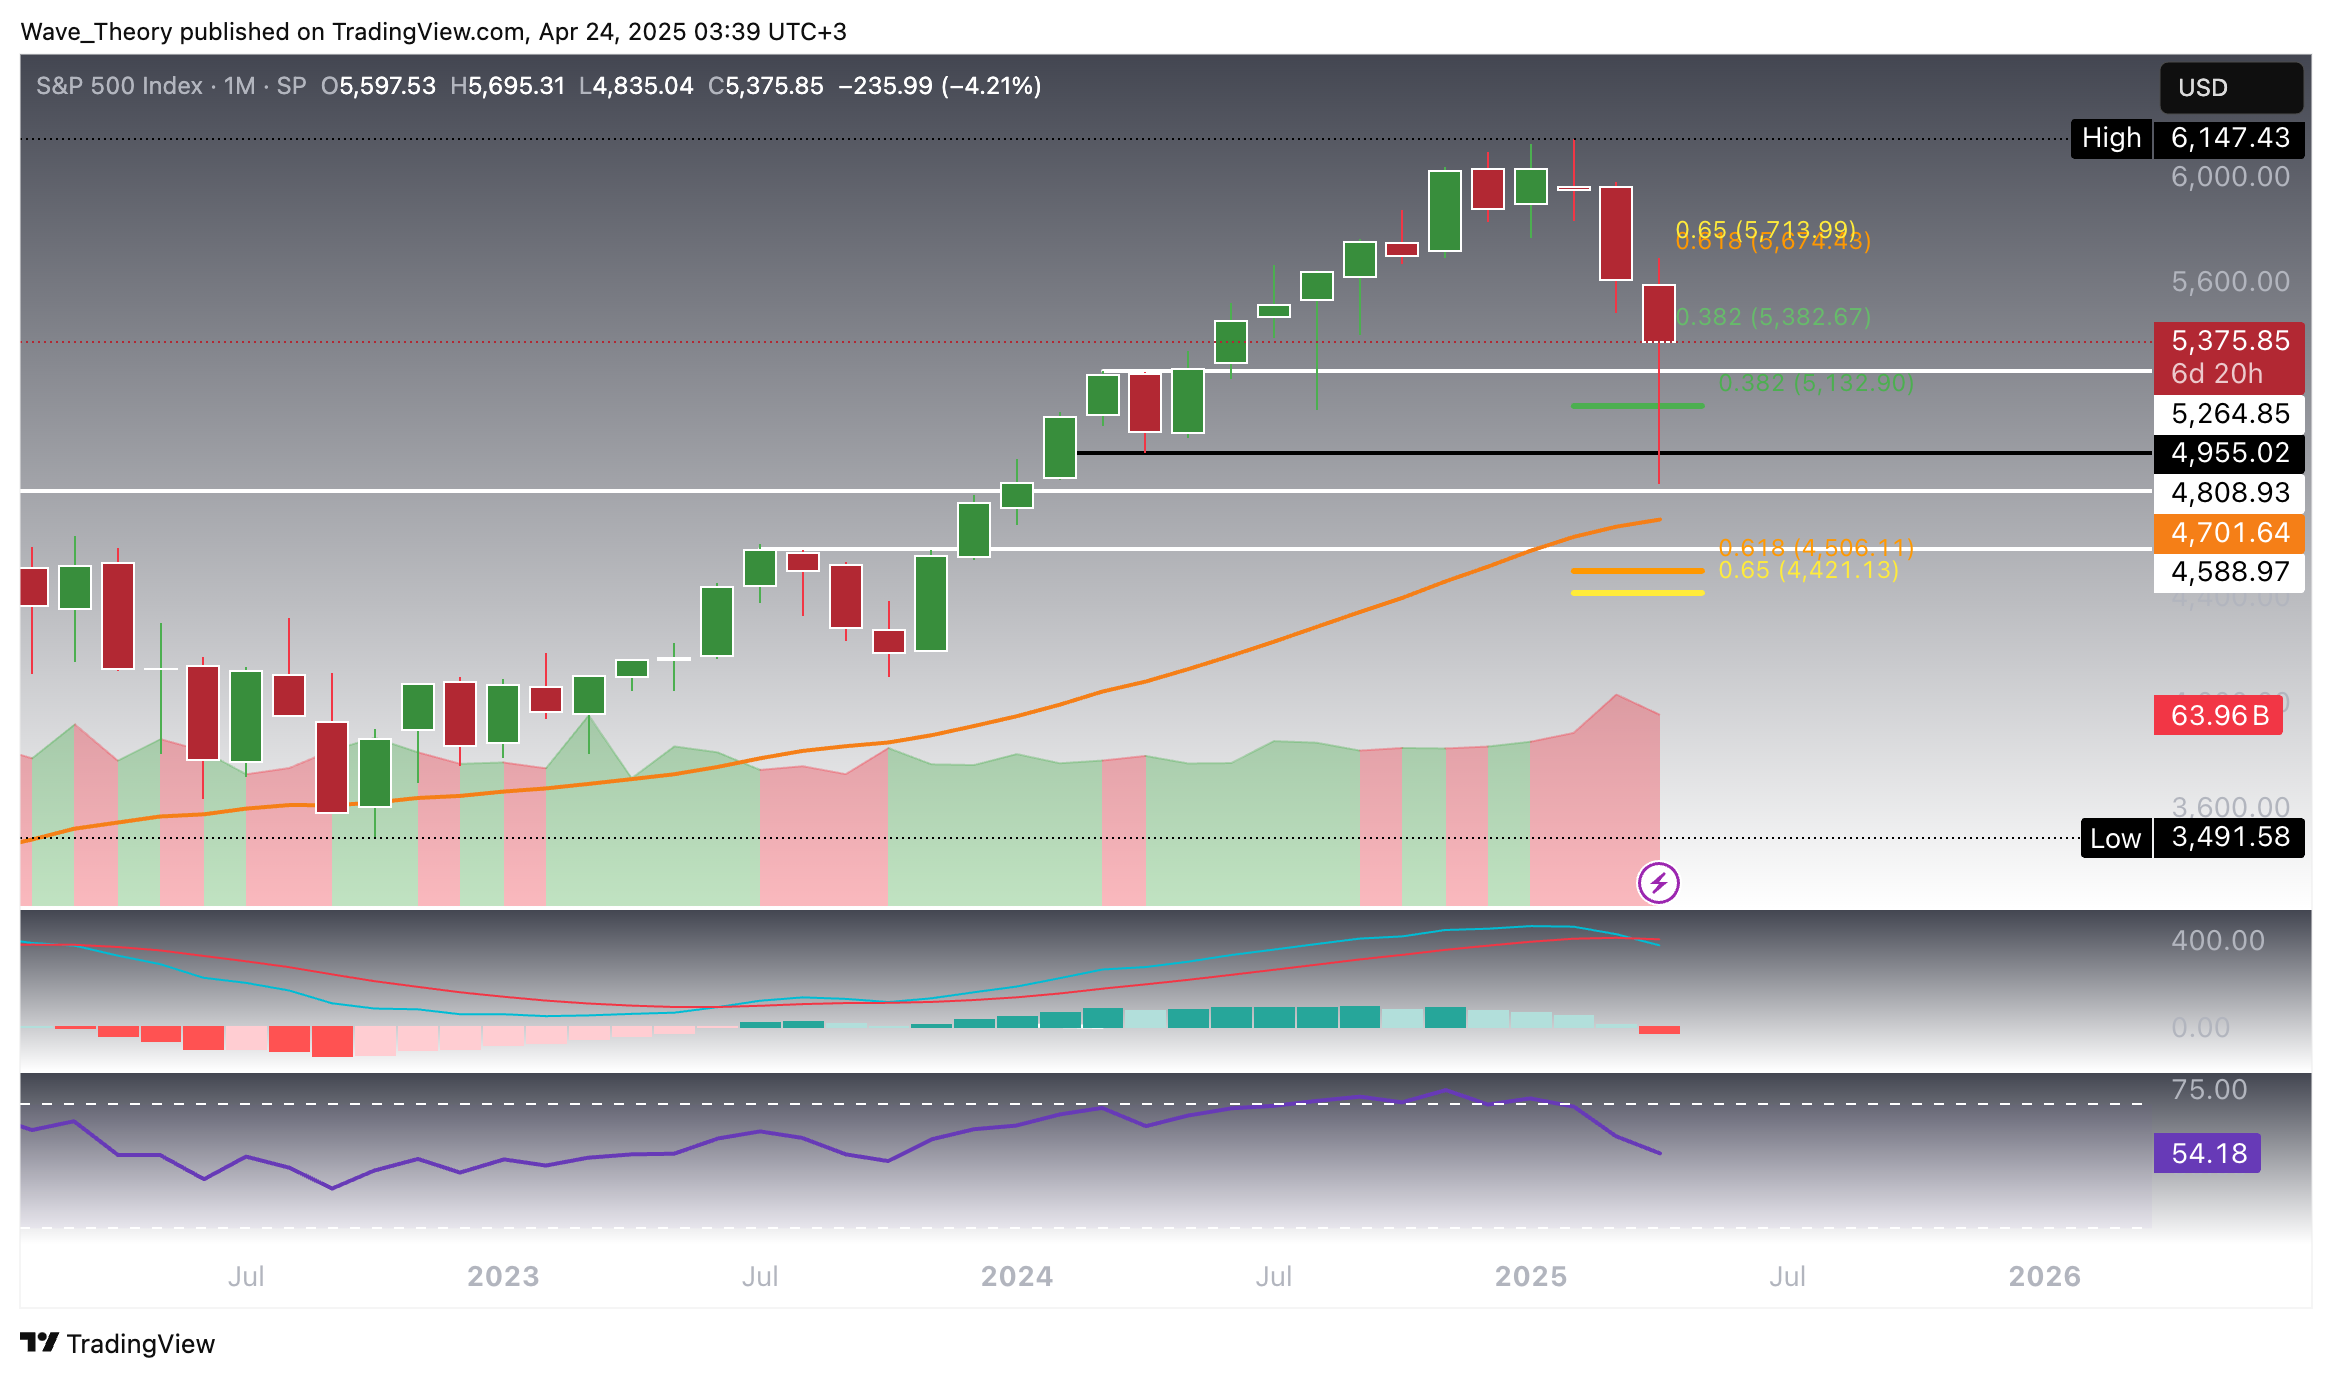
Despite the recent short-term bullish momentum, the S&P 500 (SPX) remains in a broader three-month downtrend, as reflected by the declining MACD histogram on higher timeframes. The MACD lines remain bearishly crossed, reinforcing the prevailing downward pressure, while the RSI continues to hover in neutral territory, offering little directional conviction.
If the downtrend resumes, SPX is likely to find key support at the Golden Ratio (0.618 Fibonacci level) near 4,421, followed by a broader support zone between 4,589 and 4,809. This area is further reinforced by the 50-month EMA, which serves as a critical long-term dynamic support level.
As price compresses between rising short-term momentum and persistent mid-term bearish pressure, the next directional move could provide significant insight into the market’s broader trajectory.
Konstantin Kaiser
Financial Writer and Market Analyst
Konstantin Kaiser comes from a data science background and has significant experience in quantitative trading. His interest in technology took a notable turn in 2013 when he discovered Bitcoin and was instantly intrigued by the potential of this disruptive technology.
Related Articles
www.fxleaders.com