
U.S. STOCKS OUTLOOK:U.S. stocks fall on rising geopolitical tensions in Eastern EuropeUkrainian President Zelensky says Russia may launch an offensiv
U.S. STOCKS OUTLOOK:
- U.S. stocks fall on rising geopolitical tensions in Eastern Europe
- Ukrainian President Zelensky says Russia may launch an offensive on Feb. 16 (Wednesday)
- The short-term outlook for the S&P 500 turns more bearish after the confirmation of a double top pattern
Most Read: Top 5 Events this Week: UK Inflation, Canada CPI, US Retail Sales, FOMC Minutes, Australia Jobs Data
U.S. stocks were subdued Monday amid heightened geopolitical frictions in Eastern Europe and Fed jitters. At the close, the S&P 500 fell 0.38% to 4,401, extending Friday’s big losses. Meanwhile, the Nasdaq 100 was more resilient and managed to rise 0.10% to 14,268 as Amazon, Tesla and Nvidia jumped more than 1% in late trading.
Over the weekend, the U.S. National Security Advisor issued a stark warning, indicating that President Putin could give the green light to invade Ukraine any day now. Tensions reached a new high on Monday after Russia moved artillery and long-range rocket launchers into firing positions, prompting the White House to close the embassy in Kiev. Investors’ uncertainty increased further after Ukrainian President Volodymyr Zelensky addressed the nation and stated that he has been informed that February 16 will be the day of the military incursion. The Russia-Ukraine crisis is likely to weigh on sentiment in the near term, exacerbating volatility and caping upside speculation.
Rising bond yields will be another headwind for risk assets that could prevent a meaningful recovery in the equity space. On this front, the Treasury curve shifted upwards during the session after St. Louis Fed President James Bullard doubled down on his hawkish views, stating that interest rate hikes need to be front-loaded to curb inflation.
Yields could continue to adjust higher in the coming days if other policymakers echo Bullard’s sentiment and endorse more aggressive measures to curb soaring price pressures. In any case, we should learn more about the Fed’s thinking on Wednesday, after the bank releases the minutes of its latest meeting. The document will give traders a chance to gauge how concerned the central bank is about inflation and what it plans to do in terms of tightening in the coming months.
Focusing on the S&P 500, it appears that a bearish double top formation is currently in play following last Friday’s drop below 4,450, the pattern’s neckline. If price holds below this area over the next few days, selling interest is likely to accelerate, paving the way for a move towards support at 4,300.
On the flip side, if buyers manage to push the index above its 200-day simple moving average and the 4,450 level, technical resistance is seen at 4,495, followed by 4,520, the 50% Fibonacci retracement of the January selloff.
S&P 500 TECHNICAL CHART
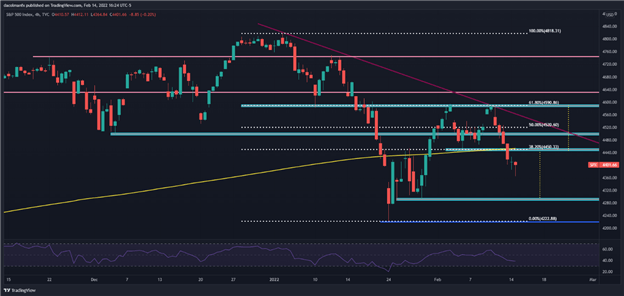
S&P 500 (SPX) Chart by TradingView
EDUCATION TOOLS FOR TRADERS
- Are you just getting started? Download the beginners’ guide for FX traders
- Would you like to know more about your trading personality? Take the DailyFX quiz and find out
- IG’s client positioning data provides valuable information on market sentiment. Get your free guide on how to use this powerful trading indicator here.
—Written by Diego Colman, Contributor
element inside the
element. This is probably not what you meant to do!Load your application’s JavaScript bundle inside the element instead.
www.dailyfx.com