
EQUITY MARKET OUTLOOKS&P 500 has lacked directional conviction in recent days following the strong rally earlier in the yearThe jump in Treasury
EQUITY MARKET OUTLOOK
- S&P 500 has lacked directional conviction in recent days following the strong rally earlier in the year
- The jump in Treasury yields over the past several days is changing the calculus on Wall Street, but sentiment hasn’t yet taken a major hit
- This article looks at major tech levels to watch on the S&P 500 in the near term
Recommended by Diego Colman
Get Your Free Equities Forecast
Most Read: Gold Prices Charge Toward Fibonacci Support as Markets Bet on Higher Fed Peak Rates
The S&P 500 has lacked conviction recently despite some wild swings on Wall Street, moving directionless over the past two weeks after surging more than 7% year-to-date. Although the mood is fragile, sentiment has yet to take a major hit due to renewed speculation that the Fed’s work is not yet done amid strong inflationary pressures.
Early last month, traders were convinced that the U.S. central bank might start cutting rates towards the end of the year, but those expectations have quickly evaporated following extremely strong labor market results, elevated CPI data and solid retail sales figures.
Recent economic developments have led traders to discount a more aggressive tightening roadmap than anticipated just a few weeks ago, increasing bets that the Fed’s terminal rate will eventually settle around 5.25% this summer, well above the 4.9% forecast earlier this month.
FED FUNDS FUTURES, BOND YIELDS AND S&P 500 CHART
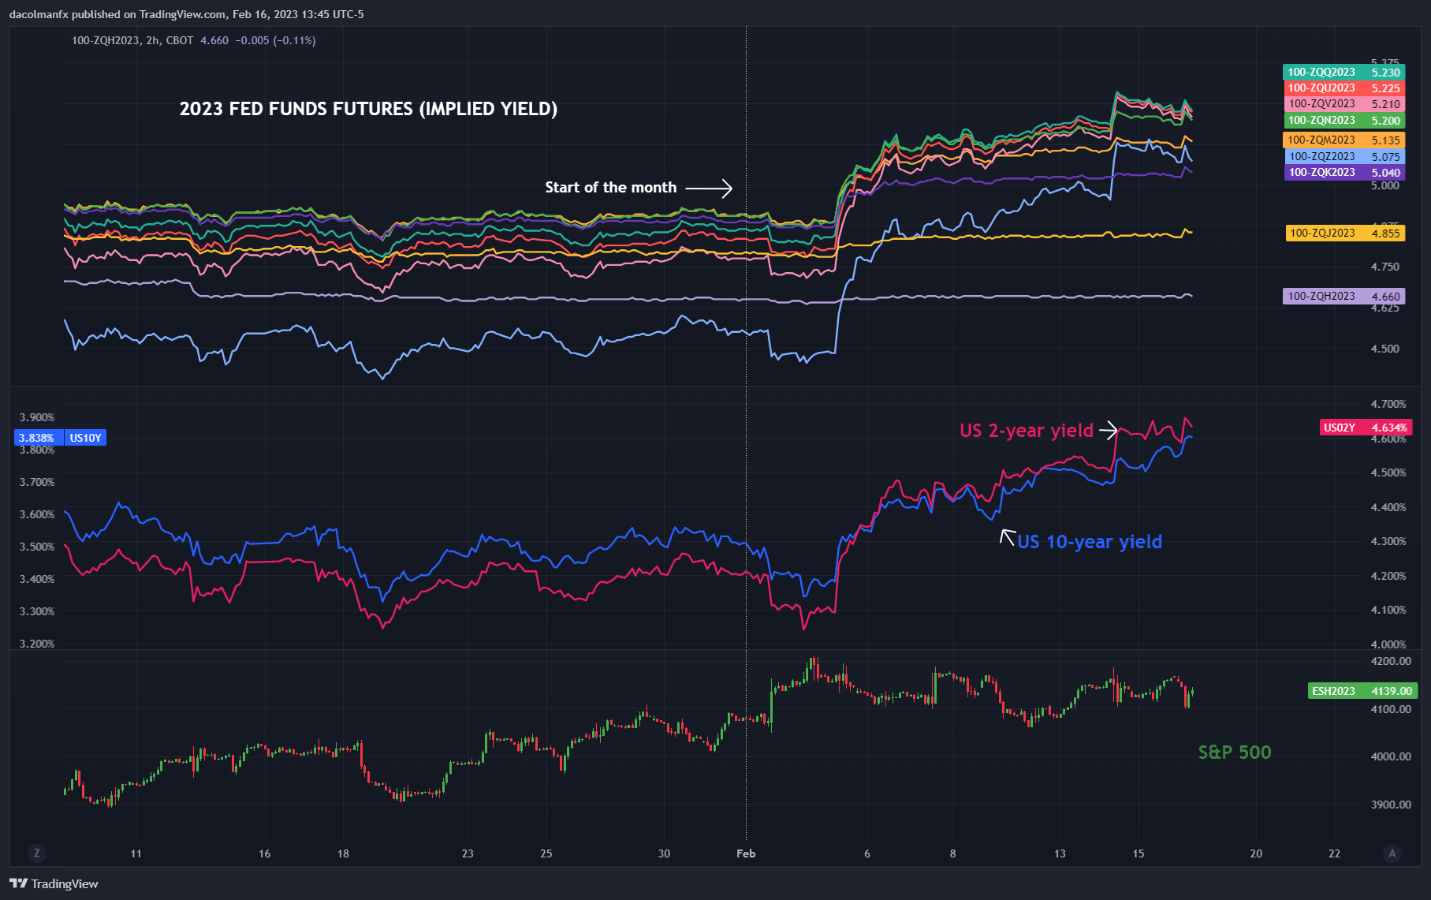
Hawkish repricing of the FOMC’s policy path have caused U.S. Treasury yields to shoot up violently in a very short time, but this move has not yet translated into a commensurate downside adjustment in risk assets, as complacency has set in. True, the likelihood of a hard landing has been reduced considerably, but the outlook for corporate earnings remains bleak, a sign that fundamentals are not yet encouraging.
While technicals and positioning may be supportive at this point, the catalysts necessary to envision a sustainable recovery on Wall Street are not yet in place. In fact, with risk-free assets such as Treasuries yielding nearly 5%, investors will have little incentive to divert capital from fixed income to equities on a sustained basis. With deep-pocket investors on the sidelines for now, stocks will struggle to extend 2023 gains.
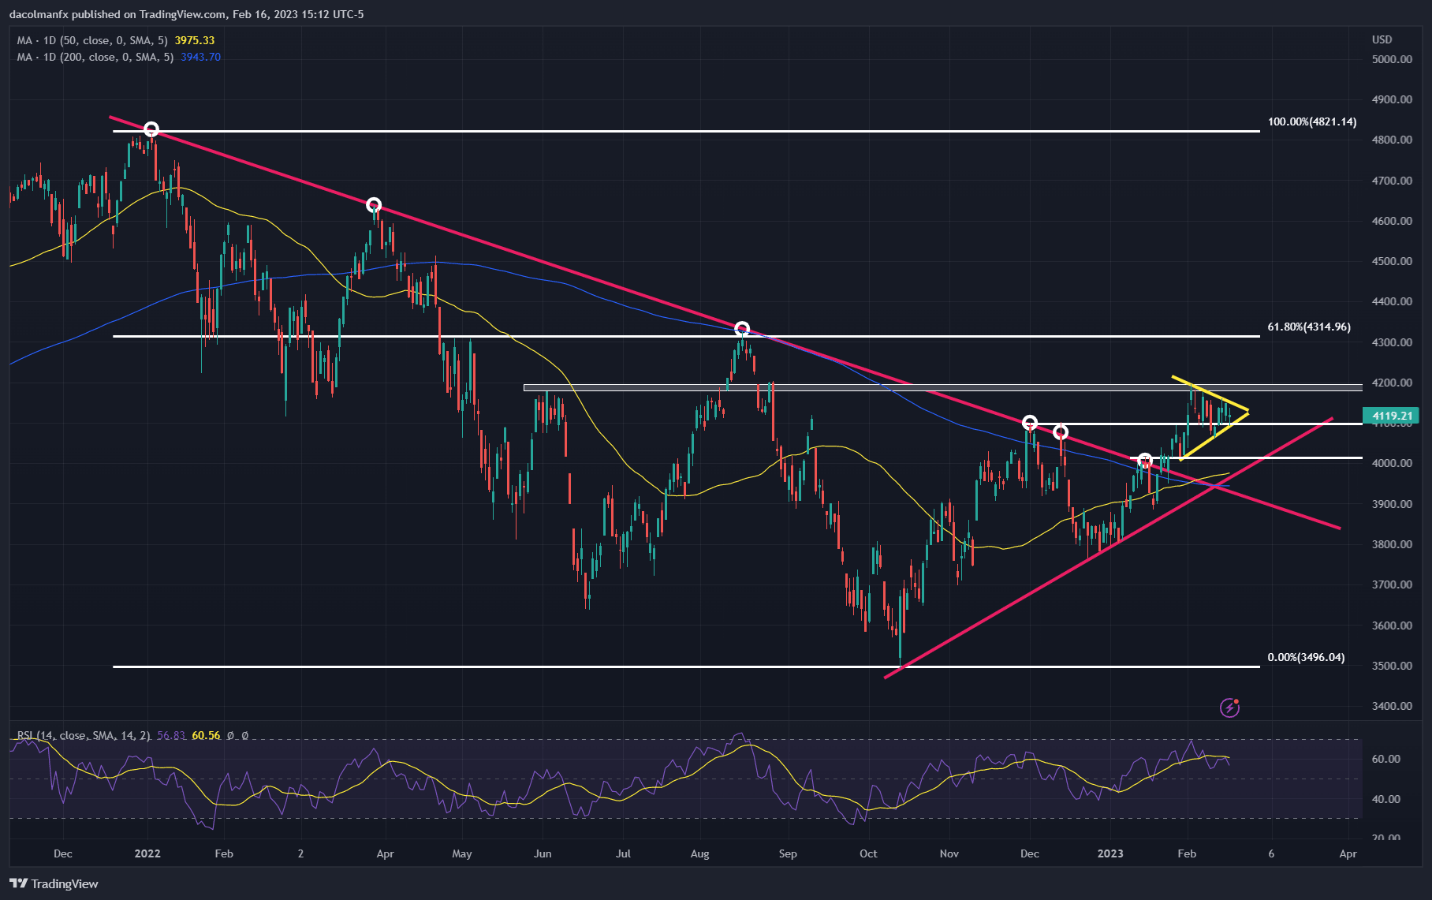
Focusing on technical analysis, the S&P 500 appears to be coiling inside a symmetrical triangle, a sign of consolidation amid market indecision. This pattern could be bullish or bearish depending on how prices resolve, with a topside breakout setting the stage for a retest of the 2023 highs and a downside confirmation leading to a pullback to the psychological 4,000.
| Change in | Longs | Shorts | OI |
| Daily | 0% | 0% | 0% |
| Weekly | -4% | 6% | 2% |
S&P 500 TECHNICAL CHART
element inside the
element. This is probably not what you meant to do!Load your application’s JavaScript bundle inside the element instead.
www.dailyfx.com