


Swiss Franc, CHF, AUD/CHF, CAD/CHF, CHF/JPY – Talking Points
- AUD/CHF faces stiff resistance at 0.6900, 200-day moving average
- CAD/CHF tracking decline in WTI, finding support around 0.7385
- CHF/JPY is on bull-flag breakout watch, clean air ahead
AUD/CHF Technical Analysis
Recent Australian Dollar strength has seen AUD/CHF trade back up to the 200-day moving average (MA) near 0.6900. Momentum also appears to be slowing, with the relative strength index making lower highs since the first test of the 200-day MA on October 18. Any weakness in the cross could see price retest trendline support below, a level that has held since mid-August. While price may appear to be stalling, confirmation of a reversal of the uptrend would come with a close below ascending trendline support.
AUD/CHF Daily Chart
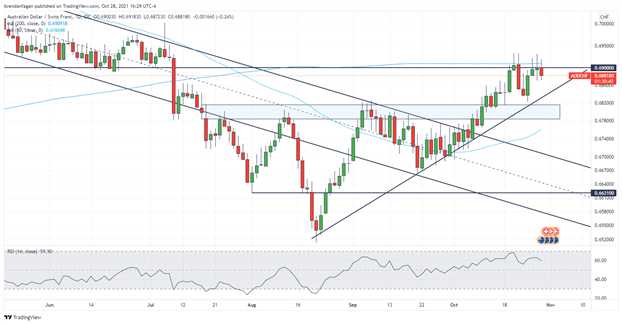

Chart created with TradingView
CAD/CHF Technical Analysis
CAD/CHF has mirrored recent weakness seen in the spot price of WTI, which has seen the pair fall to support around 0.7385. Price appreciation across commodities buoyed the pair to within touching distance of yearly highs. The pair briefly reached overbought status on October 12 with an RSI reading of 70.37, with price and momentum cooling off in the subsequent sessions. Should price maintain the 0.7385 level, market participants may look for a retest of 0.7420, a key pivot level dating back to late-April.
CAD/CHF Daily Chart
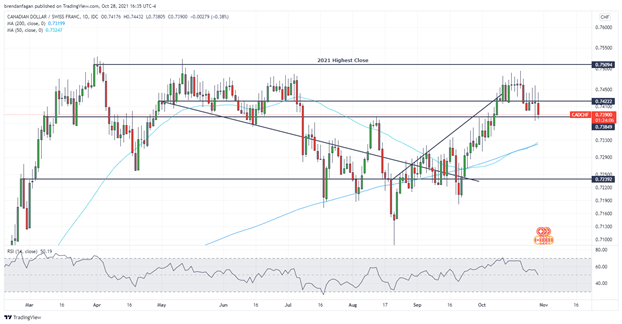
Chart created with TradingView
CHF/JPY Technical Analysis
CHF/JPY has been on breakout watch following the breakout of the first bull flag formation around the beginning of the month. The break higher from that flag took the pair to fresh yearly highs above 124.00, with a brief consolidation of price leading to the formation of a second bull flag. Having achieved what appears to be a break higher from the second bull flag, market participants may want to be cognizant of the potential for additional price appreciation. Given that price has already reached overbought territory, a stall or even a complete reversal of the uptrend could see a retest of the previous 2021 high at 122.771.
CHF/JPY Daily Chart
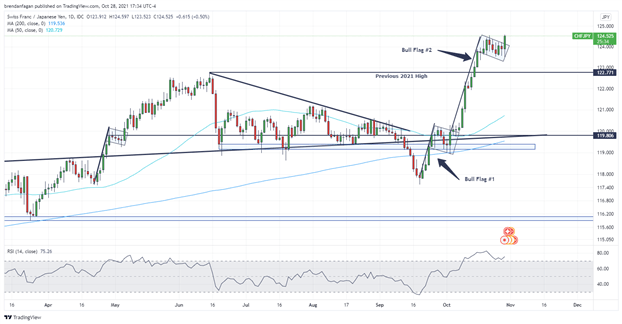
Chart created with TradingView
Resources for Forex Traders
Whether you are a new or experienced trader, we have several resources available to help you; indicator for tracking trader sentiment, quarterly trading forecasts, analytical and educational webinars held daily, trading guides to help you improve trading performance, and one specifically for those who are new to forex.
— Written by Brendan Fagan, Intern
To contact Brendan, use the comments section below or @BrendanFaganFX on Twitter
element inside the
element. This is probably not what you meant to do!Load your application’s JavaScript bundle inside the element instead.
www.dailyfx.com