


The USD/CAD pair has shown consistent support at the 20 SMA (gray), which has effectively limited pullbacks and pushed the lows higher. This technical pattern gained strength last week after a sharp rise in the Canadian unemployment rate by three percentage points, coinciding with the normalization of the U.S. non-farm payrolls report for November.
The U.S. NFP figures rebounded from October’s disruption caused by hurricanes and labor strikes, contributing to the pair’s rise. USD/CAD was trading just above 1.40, but these economic developments added upward momentum, pushing the price 2 cents higher, within reach of 1.42, buyers failed to break that resistance zone and today we saw a retreat toward 1.41.
USD/CAD Chart H1 – The 20 SMA Keeps Pushing the Lows Higher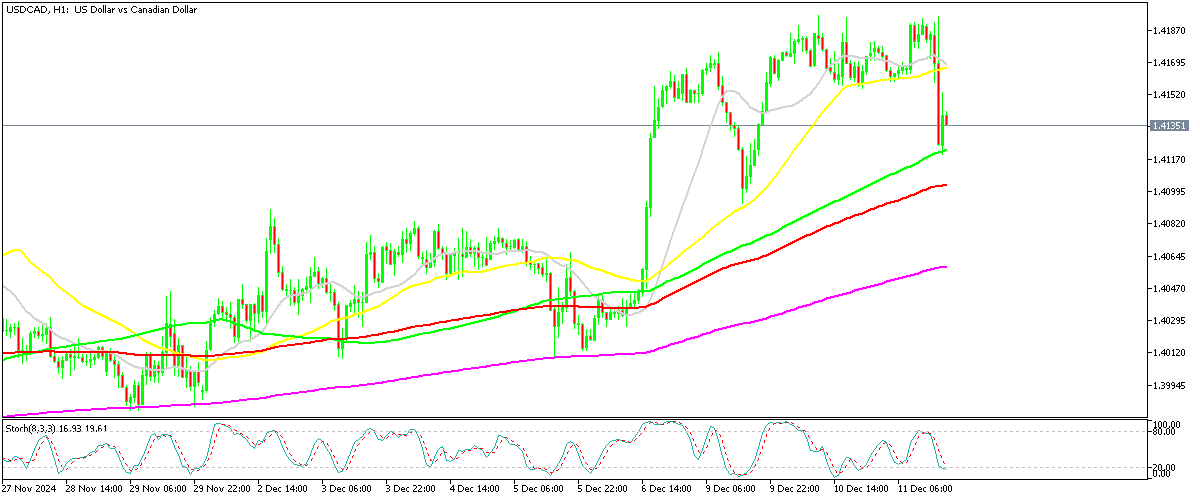

This movement also reflected broader monetary policy dynamics, particularly the 50 basis points rate cut by the Bank of England. Canadian economic data has added to the bearish tone, especially with disappointing GDP figures. After stagnation in August, September’s GDP growth was a weak 0.1%, and October’s preliminary estimate echoed the same marginal expansion. More concerning is the decline in GDP per capita, which contracted by -0.4% in Q3, continuing a trend seen throughout 2023 and 2024. The rapid growth in population further obscures the underlying vulnerabilities in the Canadian economy, making the modest GDP growth appear less robust than it is.
USD/CAD’s recent upward movement, therefore, reflects both technical support and the ongoing challenges faced by the Canadian economy. The fundamental weakness highlighted by declining per capita output and tepid overall growth suggests the pair may remain supported in the current range unless significant economic improvements materialize.
www.fxleaders.com