As the USD momentum faded in October after a massive surge in the previous two months, the CAD took advantage of this pair and retreated lower. But, t
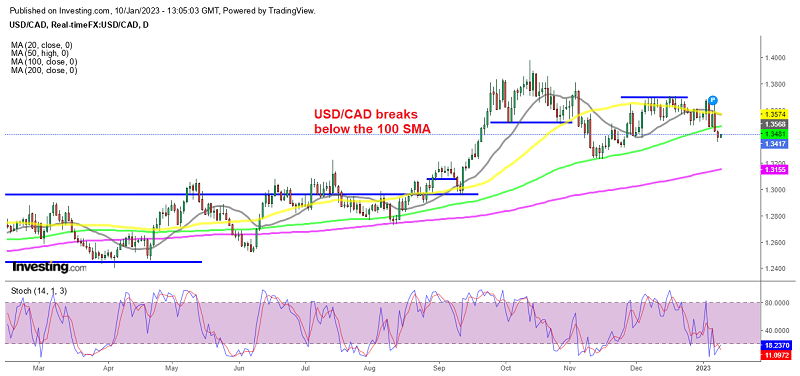
As the USD momentum faded in October after a massive surge in the previous two months, the CAD took advantage of this pair and retreated lower. But, the 100 SMA (green) held as support on the daily chart, and the price bounced back up as Oil prices fell, leading to a weaker USD.
With the USD keeping weak, sellers are looking to take advantage of the added momentum with the price now testing the 1.3400 mark. We saw a dip below this level yesterday, but the price has climbed above it now. But upon the break of the 100-day moving average (green), buyers have certainly lost control as the overall bias starts to shift slightly in favour of sellers at this point.
USD/CAD H1 Chart – The 50 SMA Acting As Resistance

Opening a sell forex signal below the 50 SMA
Today we are seeing a retrace higher as USD traders prepare ahead of Jerome Powell’s speech later, but the price has run unto the 50 SMA (yellow) on the H1 chart, which is providing resistance at the top. USD/CAD is overbought on this timeframe, so we decided to open a sell USD/CAD signal. Meanwhile, economists expect US inflation to cool off further this year, which is bearish for the USD.
The Latest Survey from the NY FED
- Year-ahead inflation expectations fall to the lowest since July 2021
- One-year ahead inflation expectations 5.0% vs 5.2% in Nov
- Three-year inflation is steady at 3%
- Five-year inflation expectations 2.4% vs 2.3% prior
- Expected household income rise 4.6% — a record
- Expected household spending rise 5.9% vs 6.9% prior
The income number will give the Fed some pause, but overall this is good for the peak inflation narrative and Fed credibility on inflation.
USD/CAD Live Chart
USD/CAD
news.google.com
