USDJPY moved up to last Tuesday high.Above 38.2% retracementThe Ueda regime has begun at the BOJ , and initial comments have been mixed. In the short
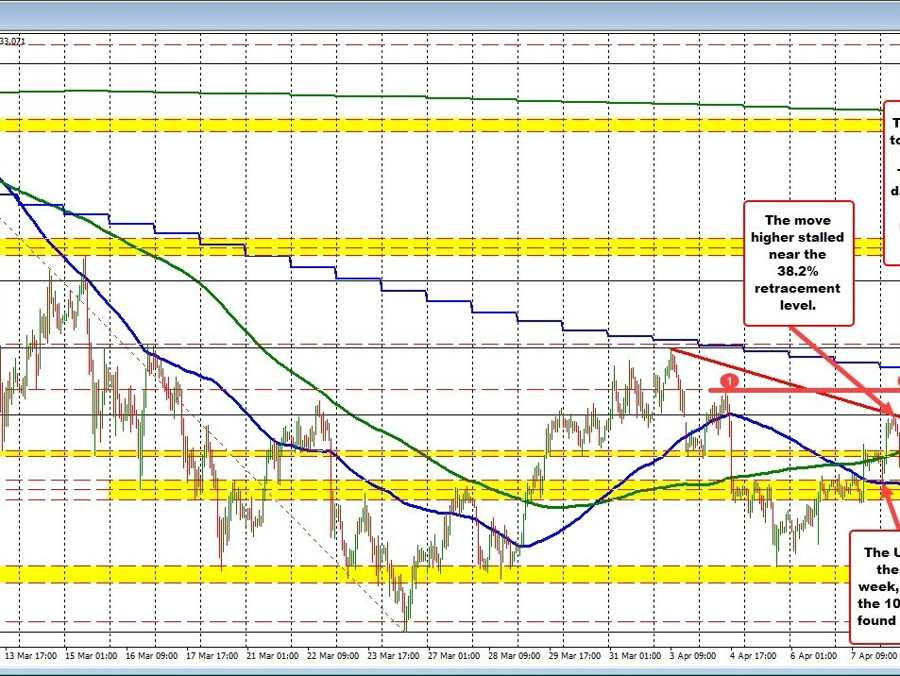
USDJPY moved up to last Tuesday high.Above 38.2% retracement
The Ueda regime has begun at the BOJ , and initial comments have been mixed. In the short term, the status quo persists, resulting in a slightly bearish JPY (and a higher USDJPY ). Concurrently, the US dollar is strengthening in early US trading as markets react to Friday’s employment report. Expectations for a 25 basis point hike in the May meeting have risen to 70%. US stocks are currently down, while yields have fallen today, with the two-year yield dropping three basis points but recovering from Thursday’s close.
Technically, the USDJPY initially declined during the first hour of trading, testing the 100-hour moving average (blue line currently at 131.778) with a low of 131.823 (it started the day at 131.802). Buyers then stepped in, pushing the price upward. The initial uptrend during the Asia session stalled at the 38.2% Fibonacci retracement level of the decline from the March high to the March low (at 132.793). Although a subsequent downward move fully retraced the day’s gains, buyers reemerged, driving the price higher over the past four hours or so. This has pushed the price above the 38.2% retracement to a high of 133.169, with last Tuesday’s high at 133.161. The current trading price is 133.045.
What’s next?
The 38.2% retracement level serves as a critical short-term risk level for intraday buyers. As the price initially stalled at that level and later broke higher, it has become more significant from a short-term technical perspective. It is worth noting that the recent highs may prompt some profit-taking, but the more critical technical level for buyers to breach is the falling 100-day moving average at 133.476.
Last week, the price reached the 50% Fibonacci retracement level of the March trading range at 133.769 but remained well below the falling 100-day moving average (higher blue line on the chart above). The last time the price traded above the 100-day moving average was on March 10. A move above this level would target the 50% retracement at 133.769. Overall, buyers are attempting to maintain their position above the 38.2% retracement level.
www.forexlive.com
