USDCHF below the 100 are moving averageLast Monday, the USDCHF price tested its 100-hour moving average (MA) line (blue line) but quickly rebounded to
USDCHF below the 100 are moving average
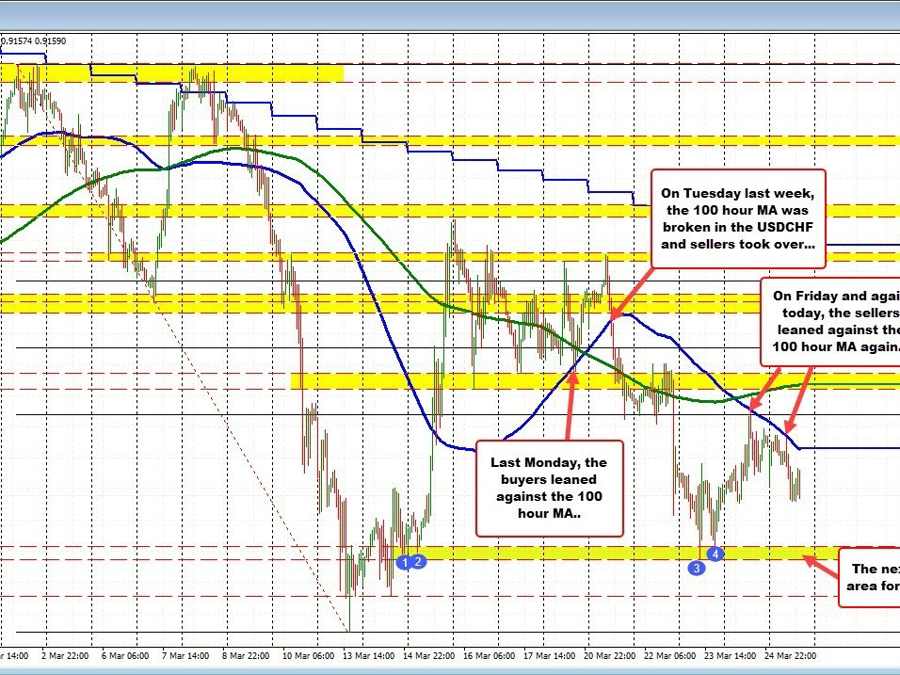
Last Monday, the USDCHF price tested its 100-hour moving average (MA) line (blue line) but quickly rebounded to the upside. The high on Tuesday, March 21, stalled within a swing area between 0.9311 and 0.9317, where sellers gained momentum. Later that day, the price dropped below the 100-hour MA (blue line) at around 0.9274, indicating that sellers had taken control.
On Thursday, the pair’s price bottomed near the swing area between 0.91179 and 0.91264 (see blue numbered circles). The subsequent rebound on Friday encountered strong resistance near the 100-hour MA (blue line), confirming the sellers’ strength as they pushed the price down.
At the start of the new trading week, the high price early in the European session met resistance once again at the 100-hour MA. The failure to move above this MA for the second consecutive day highlights its significance and reinforces the sellers’ control.
The price is currently trading at 0.9162, between the 100-hour MA above (at 0.91896) and a lower swing area between 0.91179 and 0.91264. Today’s low price stalled near Friday’s low at around 0.91545, which is providing intraday support. If the price breaks below this level, a move toward the lower extreme down to 0.91179 can be expected.
www.forexlive.com
