
Oil & Gas Talking Points:Crude oil prices finds support as supply constraints cap losses Rising energy prices weigh on Euro
Oil & Gas Talking Points:
- Crude oil prices finds support as supply constraints cap losses
- Rising energy prices weigh on European policymakers as consumers fear higher prices, carbon dioxide shortages (CO2) and a cold winter
- Inflation, FOMC Economic Projections and the BoE rate decision remains at the forefront of risk sentiment
A range of fundamental factors continue to weigh on the commodity sector, affecting prices for both oil and gas which have risen sharply throughout the year.
Although both the Federal Reserve and the European Central Bank (ECB) have continued to maintain a dovish stance throughout the global Covid-19 pandemic, rising commodity prices have raised fears that inflation may not be ‘transitory’, placing this week’s interest rate decision by the world’s two largest economies at the forefront of risk-sentiment.
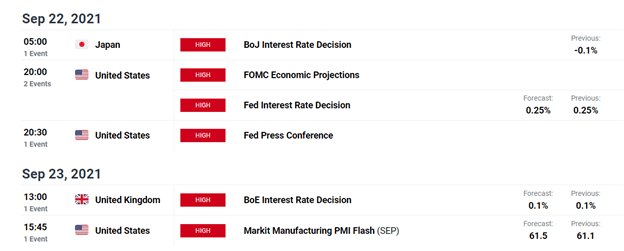
DailyFX Economic Calendar
However, supply bottlenecks were further exacerbated by disruptions in the production of WTI as oil producers off the Gulf of Mexico struggle to recover from the detrimental damages caused by Hurricane Ida.
Read about How Crude Oil Prices React to Weather-Induced Disruptions Fears
Meanwhile, the pandemic and a rise in natural disasters have caused European policymakers to shift their focus towards fighting climate change, forcing producers and suppliers of non-renewable energy to pay higher costs which have seen gas prices surge by approximately 280% this year.
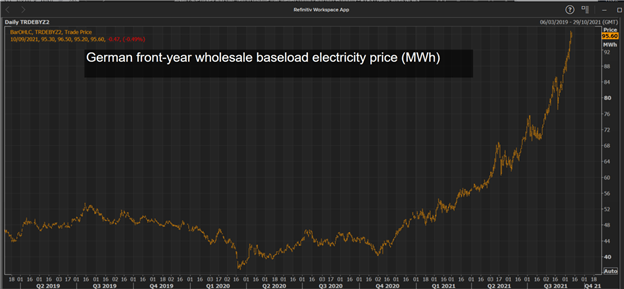
Source: Refinitiv
US Crude Oil (WTI) Prices – Key Levels to Watch
After rebounding off of the August low ($61.70), oil supply shortages supported the strong rebound in crude oil prices, allowing bulls to temporarily drive prices higher.
However, after facing a wall of resistance just below the key psychological level of $73.00, bears were able to drive prices back towards the 23.6% Fibonacci level of the August – September move, currently holding as support at $70.39.
With prices currently trading above the 50-period moving average (MA), the commodity channel index (CCI) is currently trading below 100, at least for now.
How to Trade Oil: Crude Oil Trading Strategies & Tips
Although price action currently remains encapsulated between key Fibonacci levels of the above-mentioned move, persistent supply constraints and economic woes remain the key catalysts for the imminent move.
US Crude Oil (WTI) Daily Chart
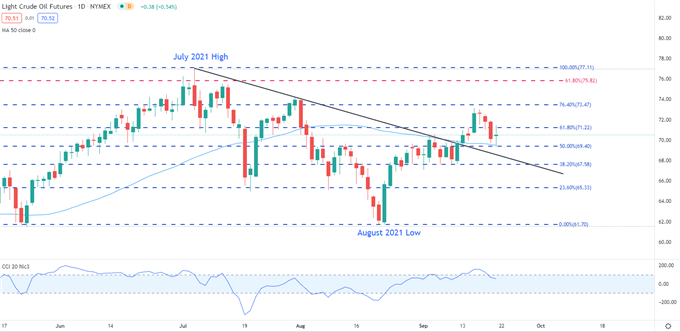
Chart prepared by Tammy Da Costa using TradingView
— Written by Tammy Da Costa, Analyst for DailyFX.com
Contact and follow Tammy on Twitter: @Tams707
element inside the
element. This is probably not what you meant to do!Load your application’s JavaScript bundle inside the element instead.
www.dailyfx.com