
We get into the heart of the Q4 earnings season this week, with results from more than 300 companies coming out, including a total of 108 S&P 500 members.
While the results thus far from the 12.8% of S&P 500 members that have reported already were dominated by the Finance sector, this week’s line-up provides a broad cross-section of all industries, ranging from Apple AAPL, Microsoft and Tesla to McDonald’s MCD, JNJ and General Electric, and many others in the middle. By the end of this week, we will have seen Q4 results from more than one-third of the index’s total membership.
The results thus far are largely in line with expectations, notwithstanding a few standout negative surprises. Results show broad top-line strength, but cost pressures are endemic, putting a spotlight on the outlook for margins.
It is this margins outlook that will determine how the revisions trend evolves through this earnings season, though estimates for the current period (2022 Q1) are holding up a lot better than was the case at the comparable time in the preceding quarter.
Through Friday, January 21st, we have seen Q4 results from 64 S&P 500 members or 12.8% of the index’s total membership. Total earnings for these 64 index members are up +22.9% from the same period last year on +13.6% higher revenues, with 84.4% beating EPS estimates and 81.3% beating revenue estimates.
Here Are the Three Things to Know So Far
The first notable feature is the deceleration in earnings growth. The charts below compare the Q4 earnings and revenue growth from these 64 index members with what we had seen from the same group of companies in other recent periods.
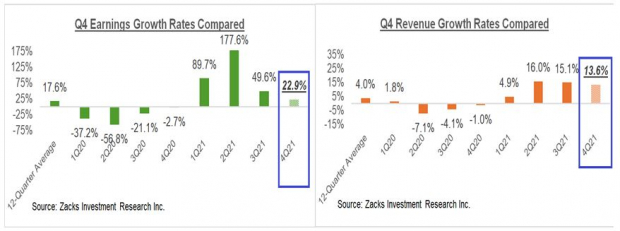 Image Source: Zacks Investment Research
The growth pace is expected to decelerate further in the current period (2022 Q1), as the chart below shows.
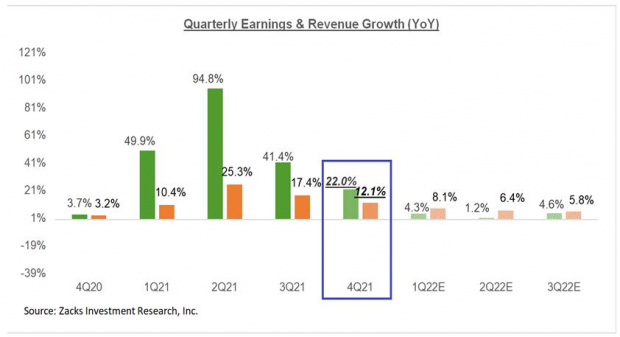 Image Source: Zacks Investment Research
Please note that the 2021 Q4 earnings and revenue growth of +22% and +12.1%, respectively, represent the blended growth rates, meaning they combine the actual results from the 64 companies that have reported with estimates for the still-to-come companies.
The chart below shows the earnings and revenue growth rates on an annual basis.
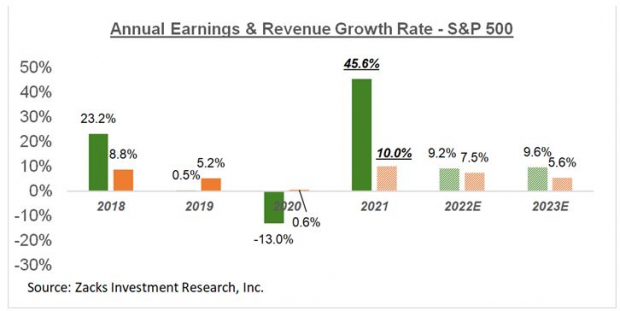 Image Source: Zacks Investment Research
The comparison charts below highlight the second notable feature of the Q4 earnings season. These charts put the Q4 EPS and revenue beats percentages in a historical context.
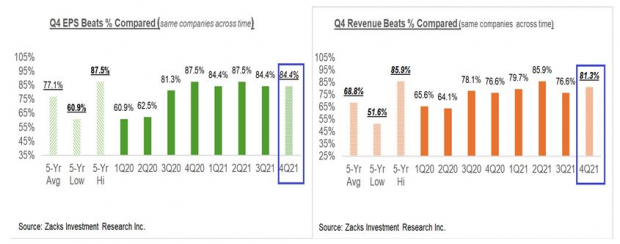 Image Source: Zacks Investment Research
As you can see here, companies are easily beating consensus EPS and revenue estimates. The proportion of companies beating revenue estimates is particularly high, though both EPS and revenue beats percentages for these 64 index members are tracking above the 5-year averages.
The comparison charts below spotlight the beats percentages for the Finance sector. You can see that Finance sector companies are struggling to beat estimates, with top-line weakness particularly notable.
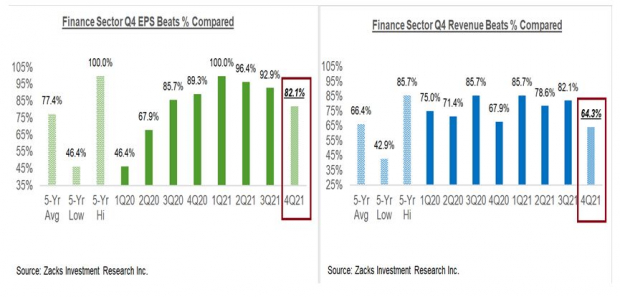 Image Source: Zacks Investment Research
The third notable feature relates to the revisions trend for the current period (2022 Q1), with the chart below showing how the earnings growth rate for the quarter has evolved in recent months.
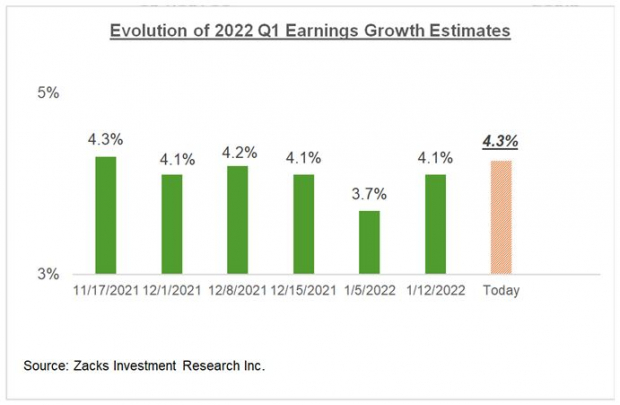 Image Source: Zacks Investment Research
Please note that this is better than what we had seen in the comparable period for 2021 Q4. But we will get a better sense of the revisions trend after seeing results from more companies and hearing from their management teams about underlying business trends.
For an in-depth look at the overall earnings picture and expectations for the coming quarters, please check out our weekly Earnings Trends report >>>> Big Wall Street Banks Provide Mixed Start to Q4 Earnings Season
5 Stocks Set to Double
Each was handpicked by a Zacks expert as the #1 favorite stock to gain +100% or more in 2021. Previous recommendations have soared +143.0%, +175.9%, +498.3% and +673.0%.
Most of the stocks in this report are flying under Wall Street radar, which provides a great opportunity to get in on the ground floor.
Today, See These 5 Potential Home Runs >>
Click to get this free report
Apple Inc. (AAPL): Free Stock Analysis Report
McDonald’s Corporation (MCD): Free Stock Analysis Report
To read this article on Zacks.com click here.
Zacks Investment Research
The views and opinions expressed herein are the views and opinions of the author and do not necessarily reflect those of Nasdaq, Inc.
www.nasdaq.com