
New Zealand Dollar, NZD/USD, US Debt Ceiling, Chinese PMIs, NZ Building Permits – Talking PointsNew Zealand Dollar may see a volatile session with
New Zealand Dollar, NZD/USD, US Debt Ceiling, Chinese PMIs, NZ Building Permits – Talking Points
- New Zealand Dollar may see a volatile session with crowded economic docket
- Chinese economic data in focus as energy woes intensify on high coal prices
- NZD/USD eyes August lows, opening the door for a potential fresh 2021 low
Thursday’s Asia-Pacific Forecast
The US Dollar reigned supreme overnight as Wall Street traders selectively moved back into US equities. The US Dollar DXY index rose to its highest level since September 2020, while the benchmark S&P 500 ticked 0.16% higher. Utility stocks outperformed, which is no surprise given surging energy prices across Europe and Asia. Natural gas dropped over 5% overnight, but prices are still north of 25% on the month.
The US debt ceiling is one of the primary market risks heading into Thursday’s Asia-Pacific trading session. House lawmakers passed a spending measure on Wednesday that would suspend the debt ceiling through December 2022. However, Republicans in the Senate are likely to block the measure, which aims to avoid a US debt default that is just weeks away.
The aim of Republicans is to force Democrats to use the reconciliation process, which would effectively curtail Democrats from passing Biden’s $3.5 trillion package. Treasury Secretary Janet Yellen urged lawmakers of catastrophic consequences earlier this week if Congress fails to act. Secretary Yellen said the Treasury would run out of cash on October 18. If that occurs, it would mark the first time in history that the United States defaults on its obligations.
Other disastrous consequences aside, that event would likely send Treasury yields soaring on demand for higher returns from global investors. That said, part of the runup in Treasury yields may be due to the current stalemate in Congress. This gives the potential for an unwind in the Treasury selloff, which could drag yields lower and spur some risk-taking in markets. The benchmark 10-year note’s yield moved slightly higher overnight. It should also be noted that less-dovish Fed monetary policy expectations are also playing a key role in the government bond market.
Elsewhere, China’s energy crisis is forcing government policymakers to take extraordinary measures. That includes a recent move to limit industrial silicon makers to cut output, according to a Bloomberg report. The country is facing rolling blackouts as energy producers struggle to meet demand. Beijing has capped how much power plants can charge. That forced a reduction in capacity output amid the sharp rise in input costs across coal and natural gas, as producers would rather enact partial shutdowns than eating those costs.
Speaking of China, the National Bureau of Statistics (NBS) will report manufacturing and services PMI figures today. Analysts see manufacturing activity dipping to 50.0 in September from 50.1 the prior month. The services sector index is expected to rise from 47.5 to 49.8. That would mark an improvement from August, but a reading below 50 still indicates contraction. The market may react on an outsized hit or miss across these data points.
New Zealand’s building permits data showed an improvement from the prior month in August, with a 3.8% m/m increase. Later today, the ANZ business confidence report for September will cross the wires. Australia is also slated to report building permits data. The Australian Dollar and New Zealand Dollar may see increased volatility today given the economic data on tap.
NZD/USD Technical Forecast
The New Zealand Dollar’s recent weakness versus the Greenback puts the August low in focus. NZD/USD is down over 2.5% since September 1. If prices breach last month’s lows, it will mark fresh 2021 lows for the currency pair. The 78.6% Fibonacci from the August/September move most recently gave way. RSI is in oversold territory and MACD is oriented firmly lower.
NZD/USD 4-Hour Chart
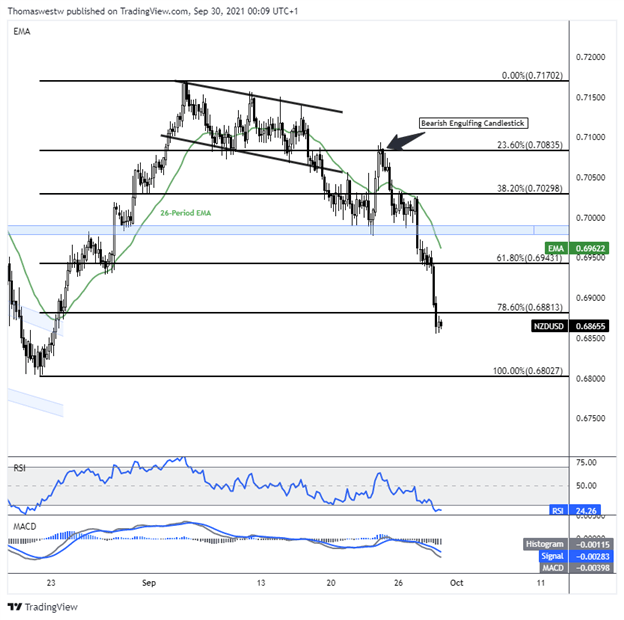
Chart created with TradingView
— Written by Thomas Westwater, Analyst for DailyFX.com
To contact Thomas, use the comments section below or @FxWestwateron Twitter
element inside the
element. This is probably not what you meant to do!Load your application’s JavaScript bundle inside the element instead.
www.dailyfx.com