
EUR/USD, GBP/USD Talking Points:It’s the part of the year that’s especially busy. And while much of the free world shops until they drop, virtuall
EUR/USD, GBP/USD Talking Points:
It’s the part of the year that’s especially busy. And while much of the free world shops until they drop, virtually or in person, traders are glued to their terminals as a raft of data brings the potential to unsettle trends and roil markets.
But, after this week, the holidays are in full view and we could very well see low liquidity conditions into the end of the year. That’s if things go according to plan. If they don’t, we might be seeing a similar outlay to Q4 of 2018 in which risk sold-off into the holidays before buoying around support, and eventually getting back into a bullish trend as the Fed turned dovish in 2019.
But, we’re not there yet, as there are a couple of key waypoints along the way that can keep the train on its tracks. Later today brings a really big FOMC rate decision and we’ve written about that numerous times already; and will be writing much more about it later this afternoon.
But outside of the FOMC, there’s a number of pertinent drivers for both EUR/USD and GBP/USD to go along with the fact that each market is sitting at a major support level.
The U.K. saw a really strong inflation print in this morning’s release, with headline inflation coming in at 5.1% versus the expected 4.7%, and core printing at 4% against the 3.7% expectation. This is a 10-year high for inflation in the U.K. and a further sign that the inflationary push seen in the U.S. isn’t relegated to just North American economies.
Tomorrow brings a Bank of England rate decision. Last month’s BoE meeting didn’t turn out well for bulls, and GBP/USD was bristling for a breakout ahead of that meeting. The bank was largely expected to hike and when they didn’t, the bottom fell out of Cable and prices put in a significant bearish push that brought into play a key support zone. I’ve been talking about that support zone for a week now and it still remains in-play.
The past six weeks of price action have seen GBP/USD traverse the entirety of the bull flag that does remain in-play. The bottom of that formation helped to set support on November 30th and two weeks later, it’s still holding the lows. But, there’s also a Fibonacci level nearby, at 1.3167 which is the 38.2% retracement of the 2020-2021 major move.
GBP/USD Daily Price Chart
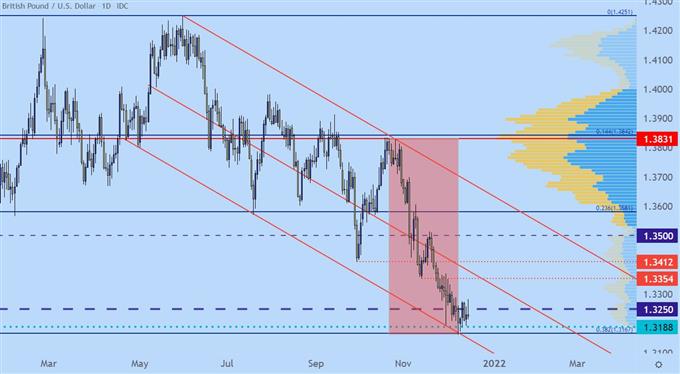
Chart prepared by James Stanley; GBPUSD on Tradingview
GBP/USD: Bigger Picture for Big Picture Levels
Taking a step back on the chart highlights how bulls might not be completely cooked yet, although the current support on the chart is a key spot for buyers to hold the lows for bullish strategies to remain in-play.
A breach of this confluent support would amount to invalidation of the bull flag formation and the next major support level-lower is the 1.3000 psychological level.
Ideal for bulls would be a hold of support today, which would likely need the Fed to err on the dovish side of the equation, at which point a hawkish outlay at tomorrow’s BoE could bring a stronger show from bulls. The bigger question is whether GBP/USD would be the optimal backdrop for such a scenario – or if there’s perhaps something even more attractive for the same outlay in another pair?
GBP/USD Weekly Price Chart
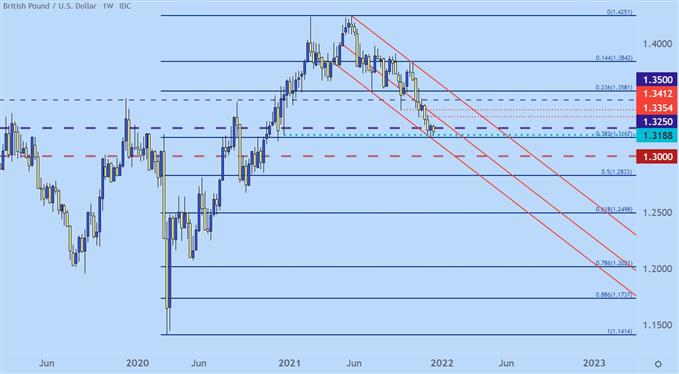
Chart prepared by James Stanley; GBPUSD on Tradingview
GBP/JPY
Perhaps more enticing on the long side from a fundamental perspective is a pair that meshes up a currency that’ll likely see some rate hikes next year against one that probably won’t.
GBP/JPY can be especially attractive from a fundamental point of view, particularly if the next few days of rate decision bring a push towards higher rates. As looked at back in September just after the Fed started to get more hawkish in the dot plot matrix, the Japanese Yen could show weakness on the back of carry trades coming back into play. And like we saw in Q1 and in early-Q4 trade, the carry trade theme can lead to significant push in the Yen.
And like GBP/USD, GBP/JPY is sitting near a major support level that I had talked about last week. The zone in GBP/JPY has essentially functioned like the floor in the pair since mid-March.
To be sure, the technical backdrop can still be argued for bearish potential, and should price take-out the 148.53 level, there could be a fast trip down towards the 145.00 psychological level. But, this seems to be something that comes into play in an aggressive risk-off scenario. If the Fed threads the needle and the BoE talks up rate policy tomorrow, the topside could remain as attractive; perhaps even more so than GBP/USD in which USD-strength may be a variable of contention.
GBP/JPY Daily Price Chart
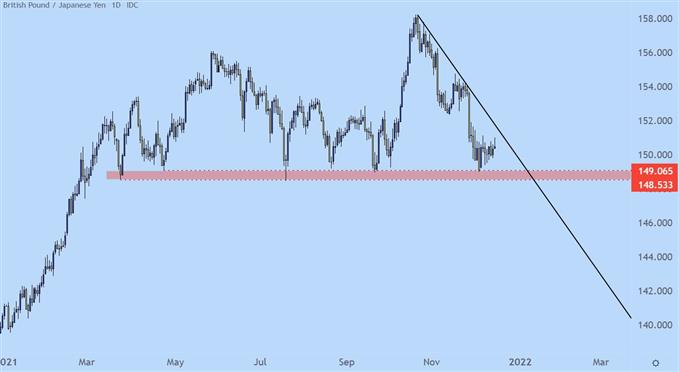
Chart prepared by James Stanley; GBPJPY on Tradingview
EUR/USD
Tomorrow brings a rate decision from the European Central Bank and the ECB has less of a pressing situation with inflation. But, there remains a litany of worries in the Euro-zone and the currency has been impressively weak over the past six months with prices falling by more than 1,000 pips already.
But, this has pushed prices to a key spot of longer-term support, spanning from Fibonacci levels at 1.1187 and 1.1212 that have played a large role in EUR/USD price action.
Each of those prices are 61.8% Fibonacci retracements from longer-term major moves. The level of 1.1212 is especially key, as this is the golden ratio of the ‘lifetime move’ in the pair, and this price helped to demarcate the range in the pair from 2015-2017.
It didn’t lose its relevancy after that, either, with price action finding support there in 2018 and early 2019 before it became resistance later in 2019 and in 2020, just before Covid came into the equation. EUR/USD broke above this zone in July of 2020 and it didn’t come back into play until late-November.
EUR/USD Monthly Price Chart
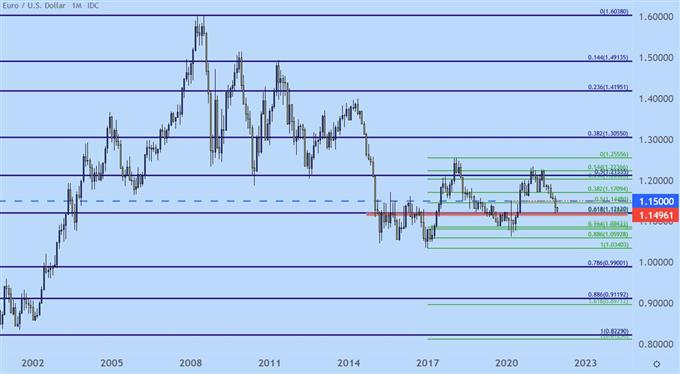
Chart prepared by James Stanley; EURUSD on Tradingview
EUR/USD Shorter-Term
The bottom portion of that support zone came into play on November 24th. Since then, buyers have been able to hold higher-low support, but they’ve also been offset at resistance with a recent series of lower-highs.
This makes for a symmetrical triangle formation and this highlights a potential breakout on the way. And when that triangle is matched up with the prevailing bearish trend, that makes for a bear pennant formation. If this should push lower, there may be some follow-through support to show from this longer-term zone of support. If bears are going to leave it behind, they’re likely going to need some help from the FOMC and ECB rate decision sitting on the calendar. So, this scenario would likely be looking for a more-hawkish Fed, looking at three rate hikes for 2022 along with a dovish ECB at tomorrows rate meeting.
There’s also Euro inflation data due on Friday, along with a massive options expiry, so that can keep the pair on the move through the end of the week.
EUR/USD Daily Price Chart: Bear Pennant
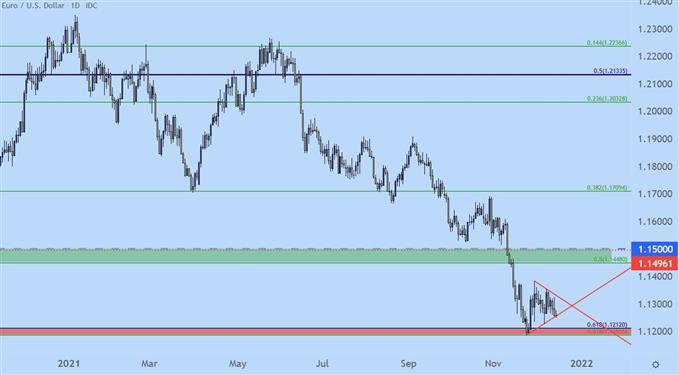
Chart prepared by James Stanley; EURUSD on Tradingview
— Written by James Stanley, Senior Strategist for DailyFX.com
Contact and follow James on Twitter: @JStanleyFX
element inside the
element. This is probably not what you meant to do!Load your application’s JavaScript bundle inside the element instead.
www.dailyfx.com