
The Euro, US Dollar, EUR/USD, Nikkei 225, Stagflation - Talking PointsThe Euro languishes as energy prices raise concernsAPAC equities went lower
The Euro, US Dollar, EUR/USD, Nikkei 225, Stagflation – Talking Points
- The Euro languishes as energy prices raise concerns
- APAC equities went lower as yields continue to rise
- Stagflation threatens global recovery. Where will EUR/USD go?
The Euro continued to threaten lower levels today as equity market routs continued on from the US lead. APAC shares went lower, except for a couple of Chinese indices buoyed as the PBOC added liquidity for the ninth day in a row.
Japan’s Nikkei 225 is down more than 2% as the ruling LDP party elected a new leader, Fumio Kashida. JGBs and JPY were little moved on the news.
EUR/USD continues to drift near yearly lows as soaring energy costs continue to raise concerns about the Continent economies’ ability to deal with the oncoming winter.
Overnight, Federal Reserve Chairman Jerome Powell and Treasury Secretary Janet Yellen gave testimony to the US Congress. Both raised serious concern about the looming debt ceiling. Powell came under attack from Democratic Senator Elizabeth Warren, who called him a “dangerous man”.
Several commentators have raised the spectre of stagflation, whereby an economy has high inflation and stagnating growth at the same time. If energy prices maintain lofty levels, this may contribute to higher costs throughout society and undermine some businesses’ ability to operate, hampering growth.
China today announced that it is looking at measures to assist power generators with price adjustments. Currently, the generators are paying high costs for coal and other energy sources, while the price they are able to charge businesses is regulated far below these costs.
The EIA/DOE Weekly Petroleum Report due out later today may have more attention than usual. OPEC+ will be meeting next week, 4th October.
EUR/USD Technical Analysis
EUR/USD has moved close to the August low of 1.1664 and the November 2020 low of 1.16026 is not far behind. These levels might provide some support on approach, but a break below there could see some bearish momentum emerge.
On the topside, resistance could be offered at the previous highs of 1.17557 and 1.19087. The 21-day simple moving average (SMA), currently at 1.17777, may also offer resistance, but a break above that level might be bullish.
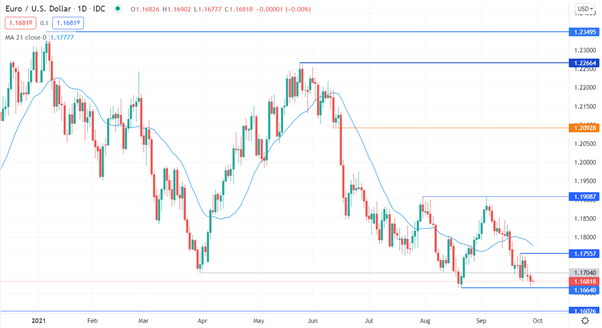
Chart created in TradingView
— Written by Daniel McCarthy, Strategist for DailyFX.com
To contact Daniel, use the comments section below or @DanMcCathyFX on Twitter
element inside the
element. This is probably not what you meant to do!Load your application’s JavaScript bundle inside the element instead.
www.dailyfx.com