
US Dollar Talking Points:It’s been a week full of rate hikes headlined by yesterday’s FOMC and this morning’s Bank of England rate decision. While th
US Dollar Talking Points:
- It’s been a week full of rate hikes headlined by yesterday’s FOMC and this morning’s Bank of England rate decision.
- While the Fed put in a 50 basis point hike, stocks surged and the Dollar dropped as the Fed wasn’t quite as hawkish as markets had begun to fear. There was building fear around a possible 75 basis point hike in June but when Chair Powell put that to bed in the presser, both themes of USD weakness and equity strength caught a quick shot-in-the-arm.
- This week’s economic calendar isn’t done yet, as tomorrow brings Non-farm Payrolls and this could keep the volatility rolling through Friday morning.
- The analysis contained in article relies on price action and chart formations. To learn more about price action or chart patterns, check out our DailyFX Education section.
The Fed just hiked rates by 50 basis points for the first time in over 20 years. But, in a display of the importance of expectations, stocks launched higher with the S&P 500 putting in its strongest rally in two years on the back of the move. And, along with that, the US Dollar dropped down for a test at a fresh swing-low.
The reason for the move is related to the building expectations for a 75 basis point hike in June that markets had been building in. So, this comes down to a question of just how aggressive the Fed wants to be in addressing inflation. If going by verbiage from various Fed members in the lead-up to yesterday’s hike, it really seemed as though most members of the bank were moving closer to desperation in looking to temper inflation. And coming into yesterday’s rate decision, a 50 basis point move in May was well baked-in, meaning that we probably weren’t going to see a shock move of a 75 basis point move there.
But – given the persistence of inflation, the door was opening to some type of communication from Chair Powell that such a move might be on the table for next month. It was when he ruled this out in the presser that markets really began to fly, with the S&P 500 jumping up to fresh highs as the US Dollar backed down.
Related to the USD move, I had written in the live blog of the event: ‘Given how strongly bid the USD was ahead of today’s event, the big question remains for how much longer this might fall. Even the Fed’s ‘softer’ framework for rate hikes still exceeds that of counterparts in Europe or Japan, so this may be a situation where those other currencies find difficulty substantiating any long-term run, at least until something changes on that front.’
The USD fall, at this point, has been rather short-lived. Price found support at the 38.2% Fibonacci retracement of the recent bull trend, spanning from April 21 up to April 28. That support set in just after the Tokyo open last night at which point USD bulls got back on the bid.
US Dollar Hourly Price Chart
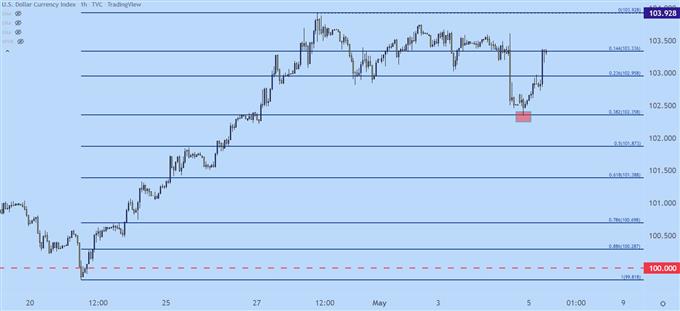
Chart prepared by James Stanley; USD, DXY on Tradingview
USD Longer-Term
We’re still in the early innings of this theme, but reviewing the daily chart, there’s potential for a large bullish move here if today’s candle can completely engulf yesterdays. This would require price to move above 103.62 today with a close above 103.47.
If that prints, the door is wide open for a re-test of the recently established 19-year-high, after which the 104.00 level comes into play.
The fuel for this move will likely come from a EUR/USD move, which I’ll look at below.
US Dollar Daily Price Chart
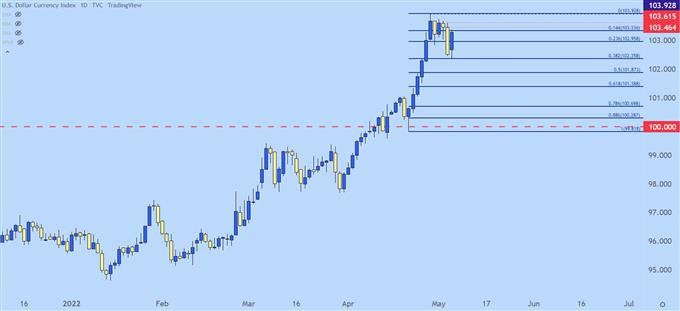
Chart prepared by James Stanley; USD, DXY on Tradingview
EUR/USD
A key component of that USD move has been the backdrop in EUR/USD. And to be sure, as the USD bullish trend has heated up, this has went hand-in-hand with the meltdown that’s shown in the Euro over the past few months.
More recently, however, support has been playing-in off of the 1.0500 level. There were numerous attempts by sellers to take this level out but, all failed as a series of higher-lows developed.
I looked into the matter on Tuesday in the pre-FOMC Price Action Setups article, saying ‘this opens the door for a test of the Friday high at the Fibonacci level of 1.0592. Above that, there’s a prior swing-low at 1.0637 after which another prior swing comes into the picture at 1.0695.’
The first two resistance targets have already been hit, and the second target at 1.0637 has, so far, helped to bring sellers back into the matter.
The bigger question, however, is whether that pullback yesterday was enough to allow for a breach of the 1.0500 level. In a normal environment, I’d expect continued topside here, largely on the basis of the recent higher-high. At this point, I’d simply look for a higher-low to further substantiate shorter-term bullish continuation until a deeper resistance target comes into play.
But, to put this whole thing into scope, we’re just past an episode of extreme risk-off behavior in markets. And all that’s happened since is a 50 basis point rate hike from the Fed, so I’m not convinced that we’ve left the big bear behind.
So, the way that I move forward is with a general expectation of normalcy, as we’ve seen coming back over the past 24 hours; but with full alert towards the alternative scenario where risk aversion comes roaring back.
This would entail holding a near-term bullish bias on EUR/USD, which can quickly be reversed into a bearish stance on a breach of support after a breach of 1.0490.
EUR/USD Two-Hour Price Chart
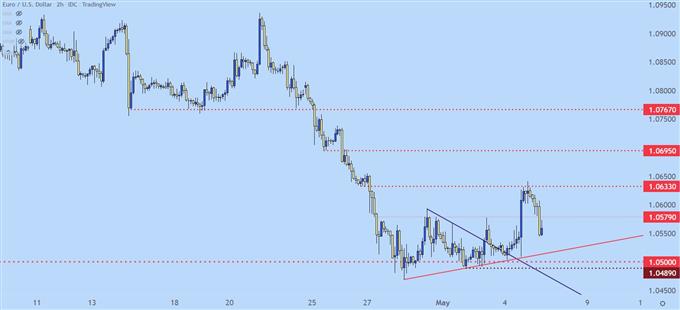
Chart prepared by James Stanley; EURUSD on Tradingview
GBP/USD
The big move this morning is the breakdown in the British Pound on the heels of the Bank of England rate decision.
The big takeaway from that rate decision, however, is the outlook at the bank seems quite a bit less optimistic than that of the Federal Reserve. The BoE highlighted the potential for inflation to run up to 10% this year. Our own Nick Cawley covered this earlier this morning, and he went over the details of the outlay if you’d like to read more.
From a price action perspective, GBP/USD could be difficult to work with at the moment given the plunge down to a fresh yearly low. For those looking to sell, the 1.2500 area of prior support, which is confluent with the 61.8% retracement of the 2020-2021 major move could be of interest for lower-high resistance.
But, outside of that, there seems to be little that’s actionable at the moment on GBP/USD that doesn’t entail chasing an already well-built move.
GBP/USD Daily Price Chart
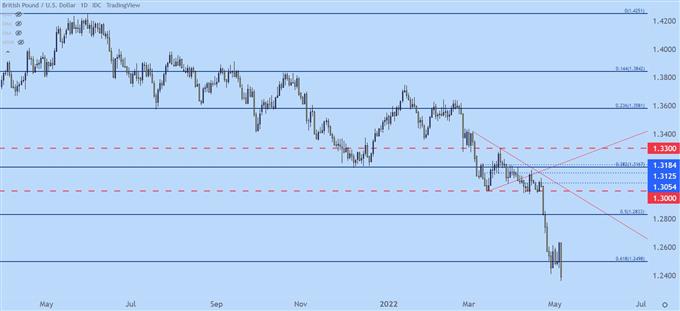
Chart prepared by James Stanley; GBPUSD on Tradingview
AUD/USD
The RBA brought a hawkish surprise earlier this week, which helped to prod some life back into AUD/USD. And, as I had looked at on Tuesday, that fresh higher-high could be the start of another bullish wave provided that buyers could hold support. And given yesterday’s USD pullback, that’s exactly what happened.
Below, I’m looking at the same two-hour price chart in AUD/USD that I had looked at a couple of days ago. The higher-low support around .7082 has held and prices jumped all the way up to resistance at the psychological level at .7250.
At this point, AUD/USD could be attractive for those that’d like to fade the USD theme of strength. AUD/USD would need to hold higher-low support above the .7082 swing to keep topside themes alive. This brings higher-low support potential to levels at .7148 and .7115.
AUD/USD Two-Hour Price Chart
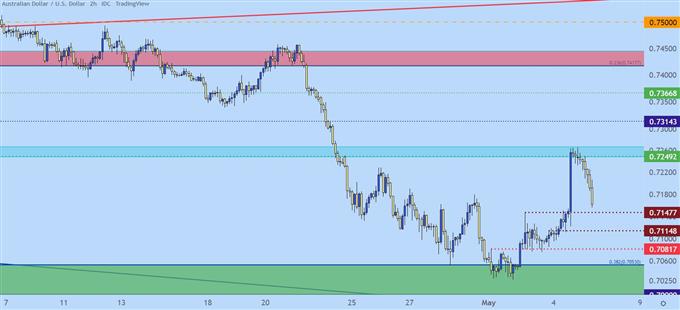
Chart prepared by James Stanley; AUDUSD on Tradingview
USD/JPY
On the topic of USD-strength, USD/JPY was up there as far as attractive venues, along with EUR/USD. But, as EUR/USD has started to tangle with the 1.0500 level, USD/JPY was having its own turbulence around the 130.00 psychological level.
The difference, however, is that while EUR/USD continues to hold support above the big fig, USD/JPY is testing through 130.00 again this morning. Highlighting a quick reversal after yesterday’s Fed-fueled breakout.
Chasing here could be problematic. However, with such a big level like 130.00 in play and with prices testing above this spot, it can be looked to for shorter-term support potential for a bullish continuation thesis.
Conversely, if we do see a near-term pullback, bullish potential still exists for support at the level of 129.41. That’s a swing-high turned support and a re-test here could open the door for higher-low support plays.
USD/JPY Four-Hour Price Chart
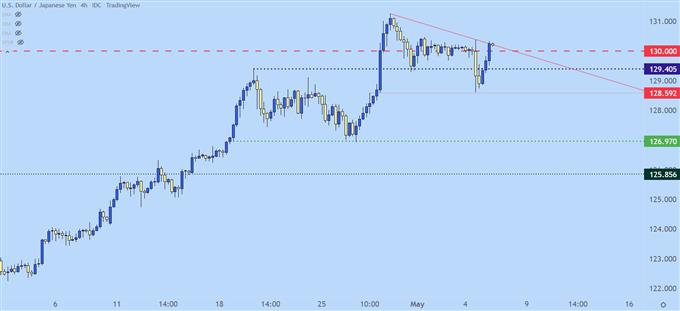
Chart prepared by James Stanley; USDJPY on Tradingview
— Written by James Stanley, Senior Strategist for DailyFX.com
Contact and follow James on Twitter: @JStanleyFX
element inside the
element. This is probably not what you meant to do!Load your application’s JavaScript bundle inside the element instead.
www.dailyfx.com