
US Dollar Talking Points:Tomorrow brings the release of CPI data from the month of May, with the expectation for headline inflation to have increased
US Dollar Talking Points:
- Tomorrow brings the release of CPI data from the month of May, with the expectation for headline inflation to have increased by 8.3% and core inflation 5.9%. Core inflation came in at 6.3% last month so a 5.9% read could be an encouraging data point for the inflation theme that’s enveloped the FOMC ahead of next week’s rate decision.
- A 50 bp hike is highly-expected next Wednesday and July seems to be primed for another 50 bp hike. The bigger question is what happens after and how hawkish the Fed might be for September and thereafter. Wednesday is a quarterly rate decision at the Fed, meaning we’ll get updated forecasts and projections and arguably this will be more market-moving than the 50 bp hike itself.
- The analysis contained in article relies on price action and chart formations. To learn more about price action or chart patterns, check out our DailyFX Education section.
The US Dollar is in the spotlight ahead of tomorrow’s CPI release out of the United States. Inflation has become the hot-button for global markets of recent, driven in-large part by the massive accommodation that was laid into markets after the pandemic came into the equation. Now – we find ourselves on the other side of the matter as inflation rates generated by this stimulus remain at extreme levels which presents a whole host of additional problems for the world to deal with.
In the U.S., the Fed didn’t want to admit this and perhaps more to the point, they didn’t want to impact the recovery. So, for all of last year, at least until Powell’s confirmation hearing in November, the Fed continued to say that inflation was transitory and set to abate, even though there was little evidence suggesting as such. Now the bank has to play catch up and next Wednesday is expected to be another 50 basis point rate hike in that effort.
But the lesson learned at the Fed appears to be falling on deaf ears elsewhere. The ECB just took a dovish approach towards trying to be hawkish as inflation in the Euro-zone has climbed above 8%. And earlier this week, the BoJ took a seemingly calm stance around an inflation print at 2.5% which would be the highest such read since 2008.
The big question around inflation in the U.S. is whether or not it’s peaked, and tomorrow could provide a bit of detail there as core inflation is expected to fall to 5.9% after last month’s 6.3% read. Headline inflation, however, which includes food and energy is expected to print at the same 8.3% as last month. But, that was down from 8.5% in the month prior. Which is, I guess, some improvement to some degree although equating that to anything the Fed has done would be presumptuous, at best, at this point.
On the chart below we can see the impact on CPI going back to the beginning of 2021. CPI quickly grew beyond the Fed’s 2% target and that growth has pretty much just continued higher-and-higher with last month’s reduction a glimmer of hope for the FOMC.
US Headline CPI Since January 2021
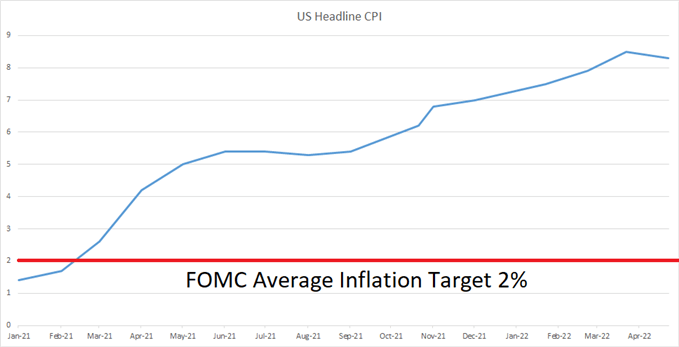
Chart prepared by James Stanley
US Dollar
The US Dollar has been taking a pause in the bullish trend since hitting a fresh high at 105 on DXY in mid-May. That 105 level is a psychological level and after coming into play, it led to a 23.6% pullback of the US Dollar’s recent bullish trend, with a point of support coming into play at the Fibonacci retracement plotted at 101.35.
That low printed last Monday and since then, buyers have been slowly getting back into the matter, pushing a bullish move up to another Fibonacci level at 102.78.
US Dollar Daily Price Chart
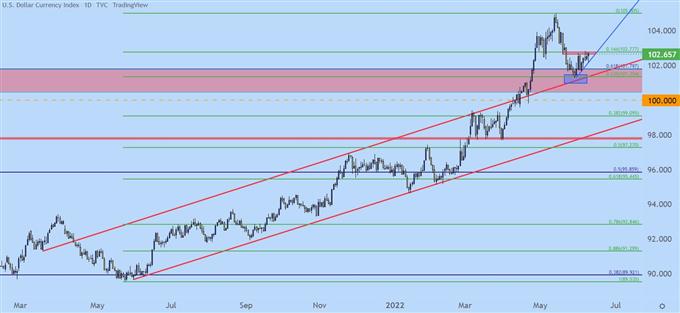
Chart prepared by James Stanley; USD, DXY on Tradingview
US Dollar Shorter-Term
On a short-term basis, bullish breakout potential exists. The recovery over the past week has taken on the form of an ascending triangle formation, which is often approached with the aim of bullish breakouts.
Given the economic calendar, this makes sense. The ECB disappointed hawks this morning and that’s led to a push-lower in EUR/USD. That’s helped to buoy the US Dollar and tomorrow brings inflation and next Wednesday brings the Fed. It appears that we have some pre-positioning going on here.
US Dollar Two-Hour Price Chart
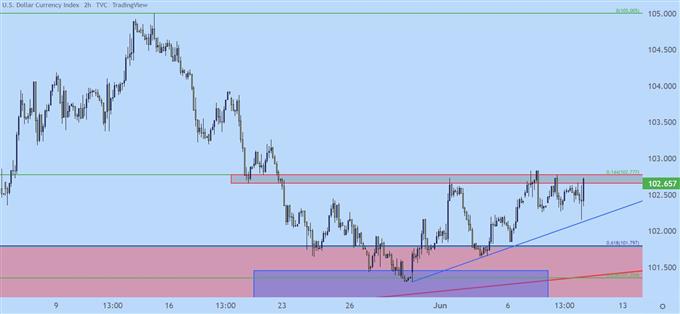
Chart prepared by James Stanley; USD, DXY on Tradingview
EUR/USD Reversal Around ECB
This morning saw a very dovish ECB trying to take on a hawkish tone. The bank seemed very reticent to commit to rate hikes despite the surging inflation and what they announced this morning seems unlikely to actually tilt the tides. But, that’s for another day.
At this point we have some disappointment to price in and EUR/USD has displayed a reversal from a key zone of resistance. This puts focus on the support zone spanning 1.0593-1.0638 and that area is now exposed for bearish breakout potential.
EUR/USD Eight-Hour Price Chart
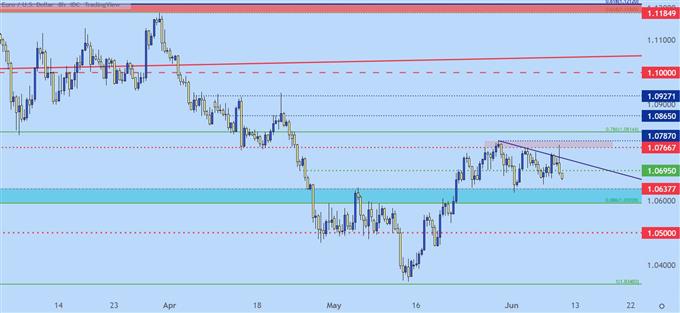
Chart prepared by James Stanley; EURUSD on Tradingview
GBP/USD Support Test
GBP/USD is less clear in my opinion than the above on EUR/USD. But – that support that’s been in-play for the past couple of weeks remains so, and we’ve seen a compressing range which could be highlighting an eventual break, in one direction or the other.
There’s a few different things going on here as the 1.2500 psychological level is confluent with the 61.8% retracement of the 2020-2021 major move. The fact that buyers have been able to hold this after the sell-off in May is encouraging and, generally, something that can keep the door open for bullish pullback potential until support is traded through.
GBP/USD Daily Price Chart
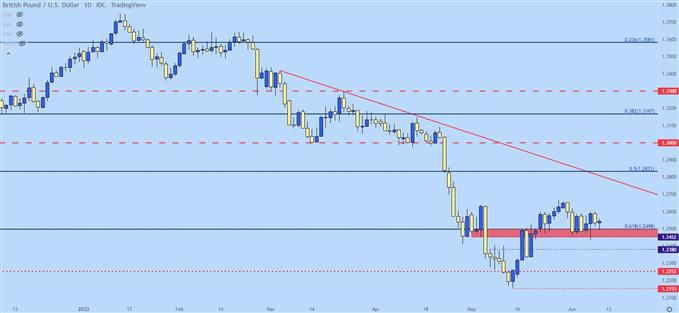
Chart prepared by James Stanley; GBPUSD on Tradingview
USD/JPY – Was that the Pullback?
On the long side of the US Dollar, USD/JPY really came back to life this week as the pair jumped up to fresh 20-year-highs. I talked about this at-length in the Tuesday webinar, sharing that this has become one of the more prominent themes in FX.
USD/JPY started to pullback last night and this ran all the way through the Euro open. But, just ahead of the US coming online a bit of support began to play at a prior point of trend resistance, taken from around 133.22.
Given the divergence between representative Central Banks along with the relevant themes of USD strength and JPY weakness, this could remain an attractive venue over the next few trading days. If support doesn’t hold at the 133.22 area, another area is rather obvious around prior double-top resistance at 131.25. And between current price and that spot is a psychological level of 132.50 that can remain as an ‘s2’ spot of support.
USD/JPY Eight-Hour Price Chart
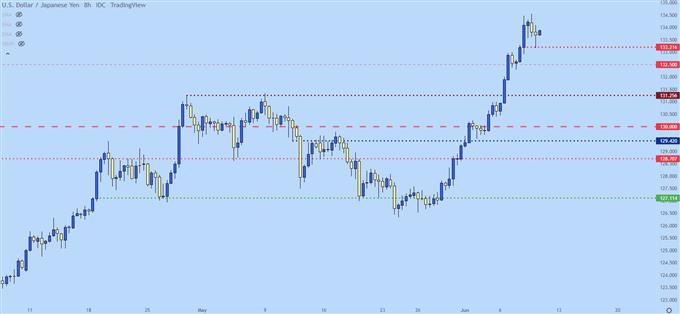
Chart prepared by James Stanley; USDJPY on Tradingview
— Written by James Stanley, Senior Strategist for DailyFX.com
Contact and follow James on Twitter: @JStanleyFX
element inside the
element. This is probably not what you meant to do!Load your application’s JavaScript bundle inside the element instead.
www.dailyfx.com