
US Dollar, USD/JPY, Yen, Treasuries, Crude Oil, Gold, Wheat - Talking PointsThe US Dollar gained ground today as a more hawkish Fed surprisesAPAC equ
US Dollar, USD/JPY, Yen, Treasuries, Crude Oil, Gold, Wheat – Talking Points
- The US Dollar gained ground today as a more hawkish Fed surprises
- APAC equities were mostly higher with the Nikkei the best performer
- Treasury yields up, boosting USD, undermining JPY. New USD/JPY highs?
The US Dollar was boosted by surprisingly hawkish comments from Federal Reserve Chair Jerome Powell that lifted Treasury yields across the curve. The US 10-year note is 18 basis-points (bp) from where it closed on Friday
The rising interest rate environment undermined the yield sensitive Japanese Yen with USD/JPY making a 6 year high.
USD/JPY and US 10-Year Treasury Yields
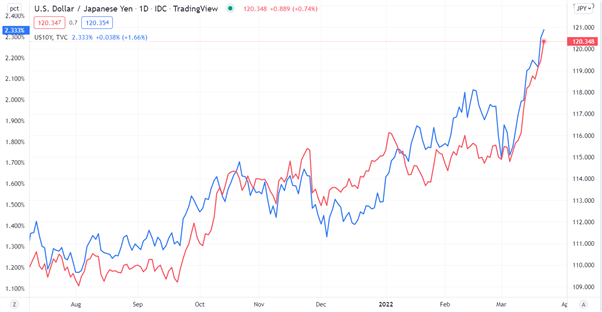
Chart created in TradingView
Fed Chair Powell said that he would be open to a 50 bp hike if conditions warranted it. The key phrase in his talk was, “if we conclude that it is appropriate to move aggressively by raising the federal funds rate by more than 25 basis points at a meeting or meetings, we will do so.”
The market is now pricing in around seven rate hikes of 25 bp in the six meetings left in 2022, implying a 50 bp move at some point.
Japan’s Nikkei 225 index is up around 1.4% in Asia due to a weakening Yen boosting the export centric bourse.
Australia, Hong Kong and South Korean indices were all in the green but to a lesser extent. China mainland indices went lower despite more re-assurances of support from government authorities.
Crude oil continued its march higher with WTI above US$ 114 bbl and the Brent crude futures contract over US$118. Gold is little changed near US$ 1,937 an ounce and wheat prices have led soft commodities higher.
Looking at the currency matrix, the US Dollar is the best performer and joined higher by AUD, CAD and NZD. The Japanese Yen was stand out underperformer with GBP and NOK lower to a lesser degree.
The full economic calendar can be viewed here.
USD/JPY Technical Analysis
USD/JPY made another 6-year high today at 120.464 and has “clean air” up to the January 2016 peak of 121.689, a potential resistance level.
Not surprisingly, the momentum signals are all currently suggesting bullishness. A break below the 5 or 10-day simple moving average (SMA) would signal a pause in that indicator.
They are currently at 119.259 and 118.193 respectively and may provide support on approach.
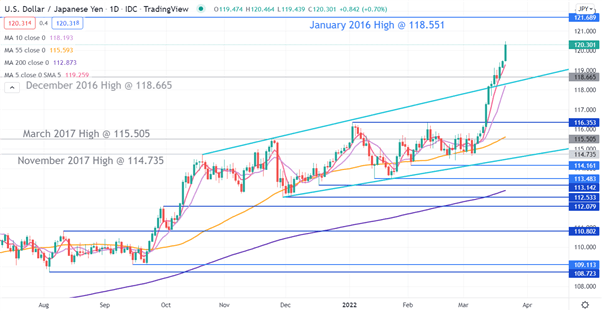
Chart created in TradingView
— Written by Daniel McCarthy, Strategist for DailyFX.com
To contact Daniel, use the comments section below or @DanMcCathyFX on Twitter
element inside the
element. This is probably not what you meant to do!Load your application’s JavaScript bundle inside the element instead.
www.dailyfx.com