
Gold Talking Points:I took a longer-term look at Gold in this week’s technical forecast, and that was held at bearish similar to this quarter’s techn
Gold Talking Points:
- I took a longer-term look at Gold in this week’s technical forecast, and that was held at bearish similar to this quarter’s technical forecast for Gold.
- Gold prices just closed the month of April below a massive spot of support, and bears have gotten a fast start this month with prices dropping by more than $30/oz in early-May trade.
- The analysis contained in article relies on price action and chart formations. To learn more about price action or chart patterns, check out our DailyFX Education section.
It’s been a fast start to the month of May for Gold and prices have already pushed down to a fresh two-month-low.
I had taken a longer-term look at the Gold market in this week’s technical forecast, focusing on bearish potential as Gold prices put in a strong reversal in the month of April. After coming into the month with some bullish potential, largely on the basis of a support hold at the 1900-1923.70 zone, bulls drove a breach of the $2k handle as a breakout materialized in the first-half of the month.
But, after that resistance test at 2k matters began to shift and sellers haven’t yet shown signs of letting up. I wrote about this last Monday, highlighting a bearish backdrop in Gold with a focus on the next support spot on the chart which I had plotted at around 1879.50. That price came into play last Wednesday before another bounce developed, with a fresh low printing at 1870.90.
And, on the resistance side of the matter, the same 1918 level that I’ve been tracking helped to hold the highs last week as sellers took another swing on Friday morning.
Gold Four-Hour Price Chart
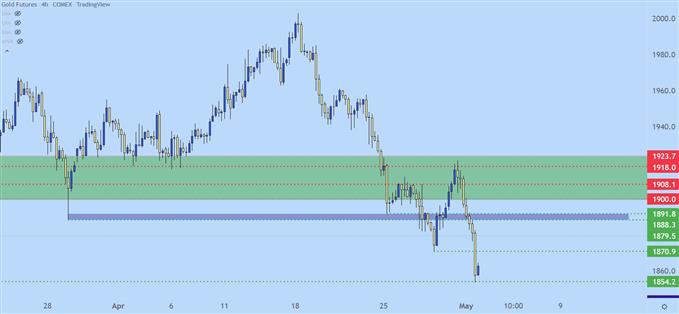
Chart prepared by James Stanley; Gold on Tradingview
Gold Prices Bigger Picture
Rates continue to rally in the US and the US Dollar just hit a fresh 19-year-high. These are both generally bearish factors for Gold although it’s not impossible for Gold to rally with both rates rising and the US Dollar trending higher. But, given the backdrop where inflation is raging and the Fed is widely-expected to quicken their approach at tackling inflation, and there could be more trouble ahead on the fundamental side of Gold.
So, it’s unlikely that this week’s bearish breach is completely divorced from the FOMC rate decision sitting on the calendar for Wednesday. More likely, we’re seeing traders position in-advance of that meeting, where the Fed is expected to hike rates by 50 basis points while adding some commentary on their plans for the balance sheet.
From the weekly chart of Gold, we can see this theme getting priced-in, with prices penetrating and progressively digging deeper into support through last week, until this week’s bar pushed down to that fresh two-month-low.
Next items of support could be tracked around 1843.30. Longer-term, there’s a major spot around 1784 and another key marker at 1683.00.
Gold Weekly Price Chart
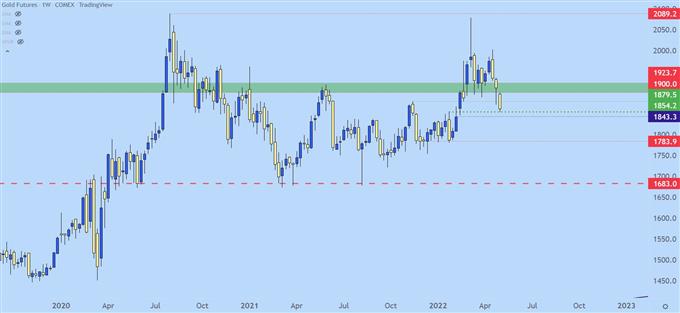
Chart prepared by James Stanley; Gold on Tradingview
— Written by James Stanley, Senior Strategist for DailyFX.com
Contact and follow James on Twitter: @JStanleyFX
element inside the
element. This is probably not what you meant to do!Load your application’s JavaScript bundle inside the element instead.
www.dailyfx.com