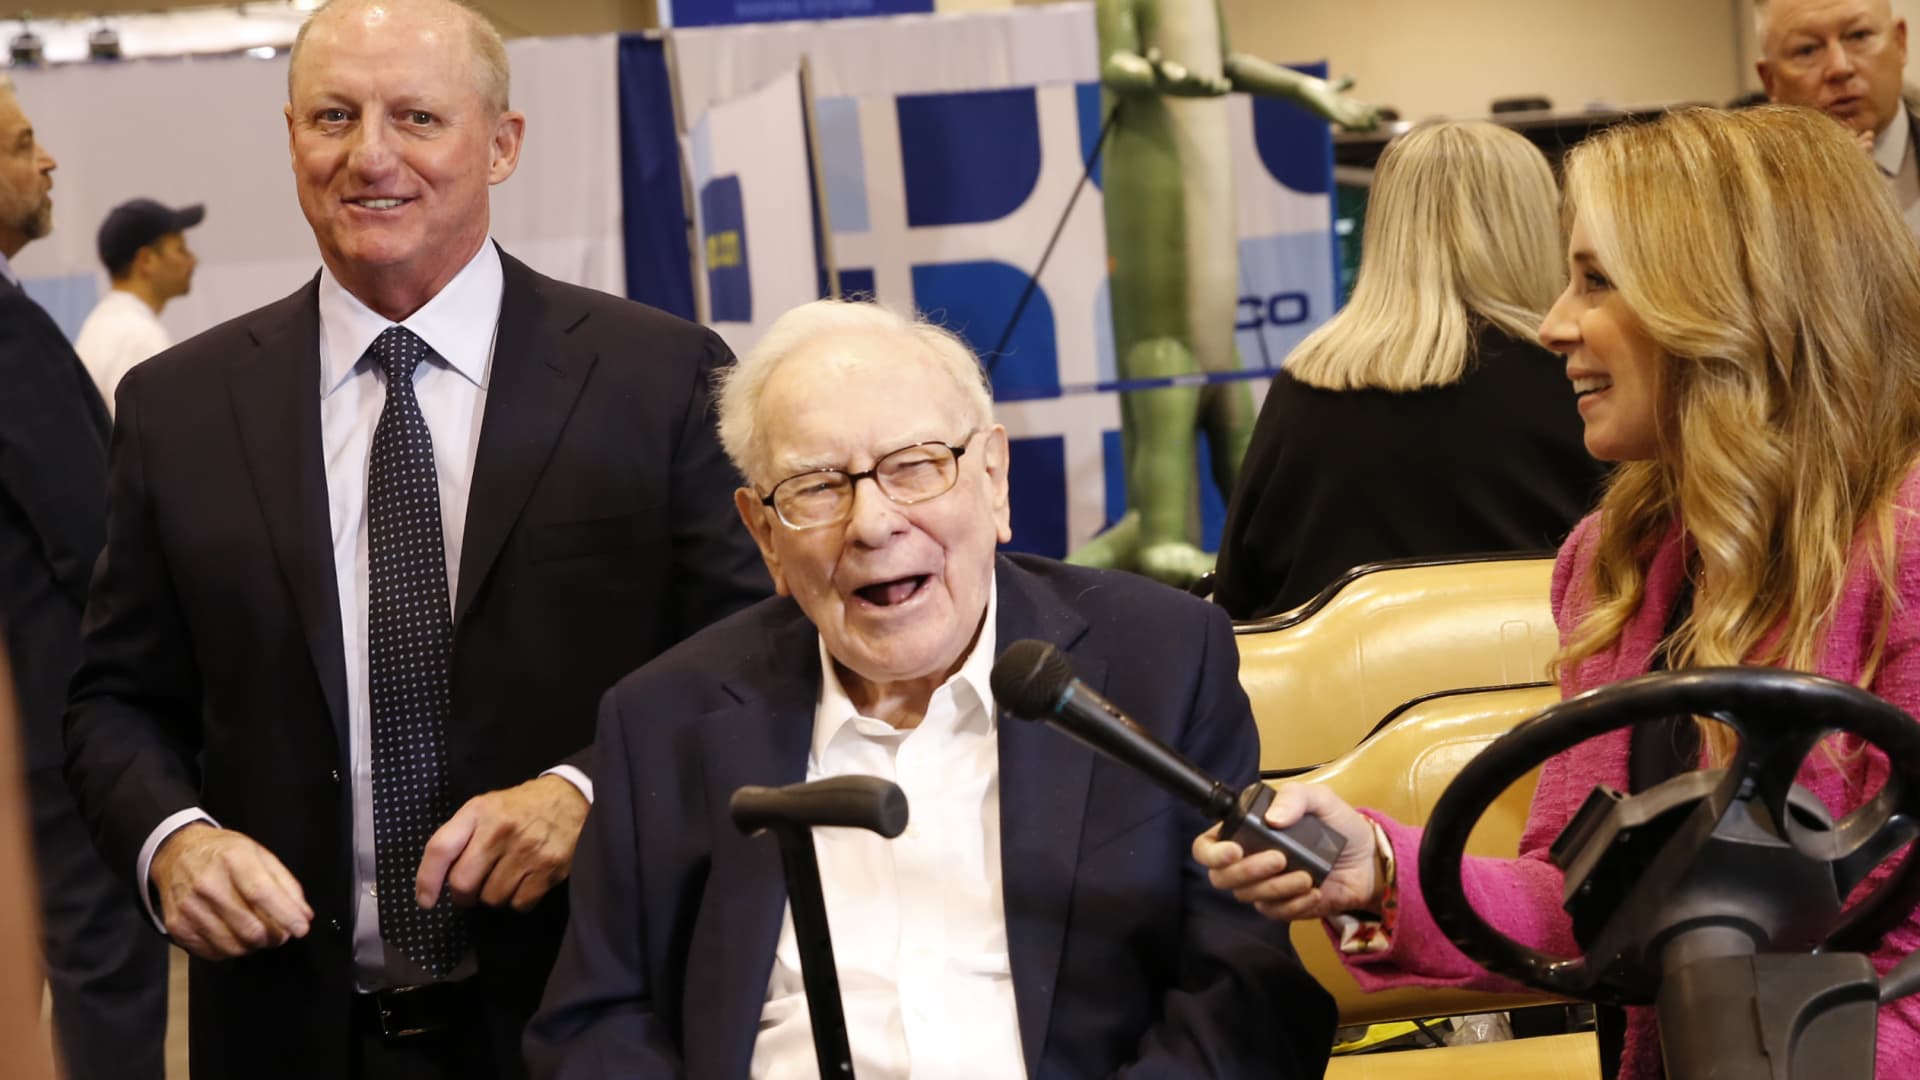
Warren Buffett and Greg Abel walkthrough the Berkshire Hathaway Annual Shareholders Meeting in Omaha, Nebraska on May 3, 2025. David A. Grogen | CNBC
Warren Buffett and Greg Abel walkthrough the Berkshire Hathaway Annual Shareholders Meeting in Omaha, Nebraska on May 3, 2025.
David A. Grogen | CNBC
When Warren Buffett relinquishes the CEO title at Berkshire Hathaway, he’ll leave investors with decades of outsized returns.
Buffett shocked the investing world on Saturday with a surprise announcement that he intends to step down from the chief executive post by year-end after six decades. Berkshire’s board approved his decision, with the billionaire continuing his other role as chairman. He’ll pass the CEO baton to designated successor Greg Abel.
The stock’s performance shows a legacy of moves under Buffett that’s allowed Berkshire’s stock to run circles around the broader market — even when including dividends. In other words, the proof is in the pudding.
To be exact, Berkshire shares have skyrocketed 5,502,284% between when Buffett took over what was then a failing textile company in 1965 and the end of 2024, according to the company’s most recent annual report. By comparison, the broad S&P 500 rose 39,054% over that time period with dividends.
Berkshire’s monster figure equates to a compounded annual return of 19.9%. That’s nearly double the 10.4% recorded by the S&P 500.
Berkshire Hathaway returns vs. S&P 500
| Gauges of performance between 1965 and 2024 | Berkshire per-share market value change (%) | S&P 500 with dividends (%) |
|---|---|---|
| Compounded annual gain | 19.9 | 10.4 |
| Overall gain | 5,502,284 | 39,054 |
Source: Berkshire Hathaway
That outperformance has been driven by some years where Berkshire’s stock left the broader market in the dust. In 1998, for example, Berkshire surged 52.2% while the S&P 500 advanced 28.6%. Berkshire shares soared 129.3% in 1976, far outpacing the S&P 500’s 23.6% gain.
In other years, Berkshire was able to side-step declines that dragged on the market. As technology stocks led a market meltdown that pulled the S&P 500 down 18.1% in 2022, Berkshire was able to end the year with a 4% increase. In 1981, while the S&P 500 slid 5%, the Nebraska-based conglomerate rallied 31.8%.
To be sure, there were some periods when Berkshire lagged. Most recently, as the S&P 500 rebounded by 26.3% in 2023, the company’s stock added just 15.8%. Berkshire finished 2020 higher by 2.4%, underperforming the S&P 500 by 16 percentage points.
Still, Jeremy Siegel, a finance professor at the University of Pennsylvania, noted Berkshire’s ability to outperform the S&P 500 by nearly 2% over the last decade.
“For a value-oriented investor to be above the S&P 500 over the last 10 years — which have been one of, if not the, most difficult decade for value investors in the 100 years — is absolutely extraordinary,” Siegel told CNBC Monday morning. “I don’t think any value investor can touch him.”
Buffett is poised to end what should be his final year as CEO on a high note. Class A shares of Berkshire have climbed nearly 19% in 2025 and hit an all-time high ahead of the annual meeting on Friday. The S&P 500 has dropped more than 3% year to date.

Class A Berkshire shares vs. S&P 500
www.cnbc.com
