
Over $328 billion has been wiped from the global crypto market in the last seven days. That’s more than the market capitalization of pharmaceutical gi
Over $328 billion has been wiped from the global crypto market in the last seven days. That’s more than the market capitalization of pharmaceutical giant Pfizer. Many investors, both new and veteran, will be trapped in the falling market and unable to cash out without incurring heavy losses.
According to data from Intotheblock, 28% of bitcoin investors and over 31% of ethereum investors are “out of the money” right now – meaning the prices of both cryptocurrencies are now less than what they paid for them. For other assets like Cardano, more than 87% of investors are in the red.
So, what happens now?
1. Buy the crypto dip using dollar-cost averaging
It’s all too easy to be on the wrong side of a crypto trade when markets turn wildly volatile, but that doesn’t mean you have to sit there and watch your portfolio plummet by the hour.
Investors who have held back a reserve of fiat currency or stablecoins, or have expendable capital in their bank accounts, will have the ability to “buy the dip.” This common phrase used throughout the crypto industry refers to the practice of buying up an amount of cryptocurrency whenever there’s a significant bearish correction in the market.
The idea is, if and when prices return back to their previous highs, the dip buyers will bank a nice profit. This echoes the infamous preachings of stock trading legend Warren Buffett, who once said “When there’s blood on the streets, you buy.”
While buying the dip can be done in a single trade, the most recommended strategy is to implement something called “dollar-cost averaging (DCA).” This involves breaking up your reserve funds into smaller tranches and making several trades over time.
For example, let’s say you have $1,000 in reserve funds. A good DCA strategy would be to break up the amount into five tranches of $200 or even 10 tranches of $100 and place trades using those smaller amounts.
The thought behind this is, it’s incredibly difficult to know exactly when an asset has bottomed out (reached the lowest price before reversing), so instead of spending all your money in one go, it usually works out better to buy a small amount and wait to see if the asset falls in price further. If it does, buy a little more, and so on.
Buy the dip, they said. pic.twitter.com/EHxMn4WPWP
— BowTied Alpaca | Chad Biglaw Attorney (@bowtiedalpaca) January 21, 2022
Doing this will typically garner much better results than if you had invested all your capital in a single trade – unless, of course, you were lucky enough to go all-in at the perfect time.
Read More: Dollar-Cost Averaging: A Low-Risk Strategy to Ride the Bull Market
2. Use indicators to find the best entry point
For investors that possess a basic or higher understanding of technical analysis – the practice of predicting an asset’s price movements based on chart trends, indicators and patterns – it’s possible to use certain indicators to gauge when an asset has reached a bottom.
Of course, no indicator is completely foolproof, but they can often give you a strong signal when to buy a dip.
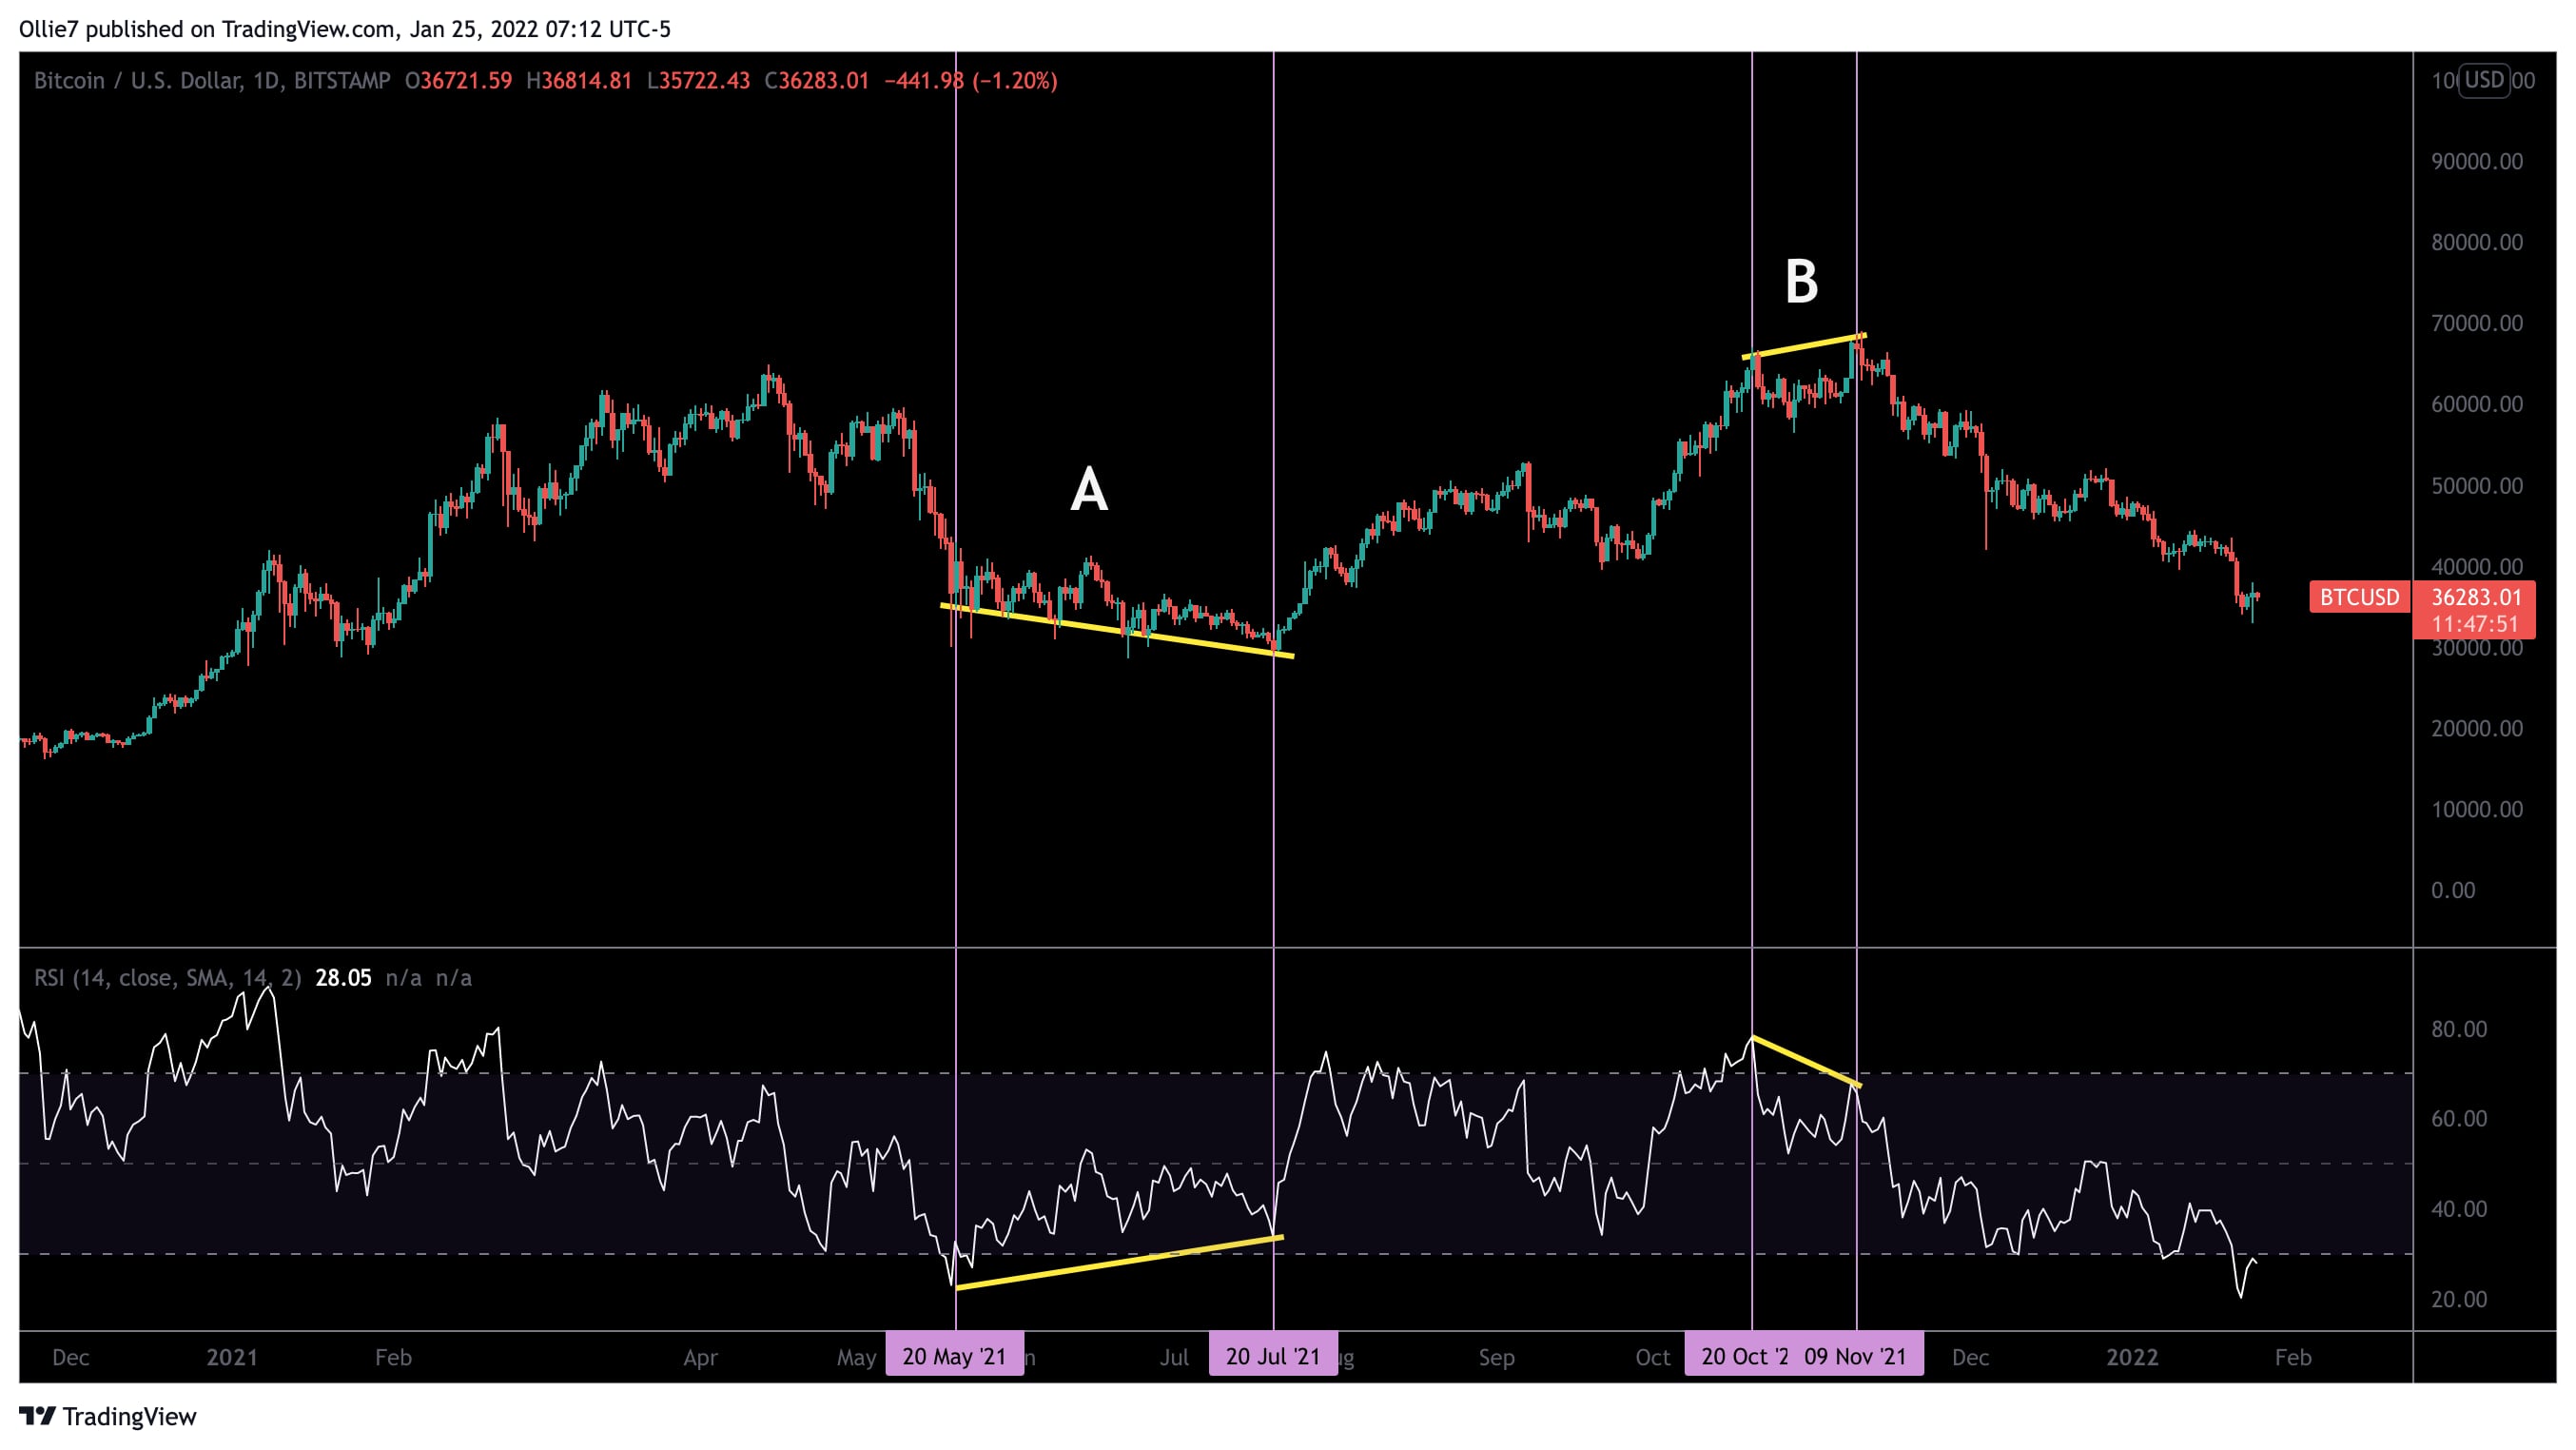
A popular method is to use the Relative Strength Index (RSI) indicator – a momentum oscillator characterized by a channel and a line that oscillates in and out of it. There are two key elements to this tool:
- Overbought: When the indicator line breaks out above the channel the asset in question is considered “overbought” – in other words, overvalued – and usually signals that prices will fall back down soon.
- Oversold: When the indicator line breaks out beneath the channel the asset in question is considered “oversold,” or undervalued, and usually signals that prices will rise soon.
While these two signals can be used alone to good effect they don’t always accurately predict bottoms or tops, particularly on lower time frames such as the four-hour, hourly or 30-minute options. A better method is to employ the RSI divergence strategy.
One thing to note about the RSI is it usually follows a similar pattern to an asset’s price, meaning when the price falls, the RSI indicator line also falls. However, there are times when the two lines move in opposite directions. This is known as an RSI divergence, and typically indicates the beginning of a trend reversal.
To spot a bottom, you will need to see if the RSI line makes a higher high while the corresponding price makes a lower low. Ideally, the RSI line will be near or into the oversold region on a larger time frame, such as the daily, to signal a strong reversal opportunity.
Below, we can see an RSI divergence on bitcoin’s daily chart (A) signaled a strong reversal in the trend followed by a rise in price. Three months later, another RSI divergence emerged (B), this time in the overbought region – signaling a bearish trend reversal that quickly followed.
Read More: 3 Simple Long-term Crypto Investing Strategies
3. Diversify your investments across different crypto assets
Just like it’s nearly impossible to accurately…
www.coindesk.com