
By Roxanna Islam, CFA
Summary
- Interest in municipal closed-end funds (CEFs) vs. municipal bonds often stems from higher return potential—this is mostly due to the use of leverage in municipal closed-end funds.
- Leverage could potentially amplify both the fund’s net asset value (NAV) and its distribution; however, investors should be aware of the rationale and risks behind leverage.
- While an extended period of demand for municipal bond CEFs has caused valuations to reach record premiums, distributions are still relatively high compared to other income-oriented sectors.
What is happening with municipal bond closed-end funds today?
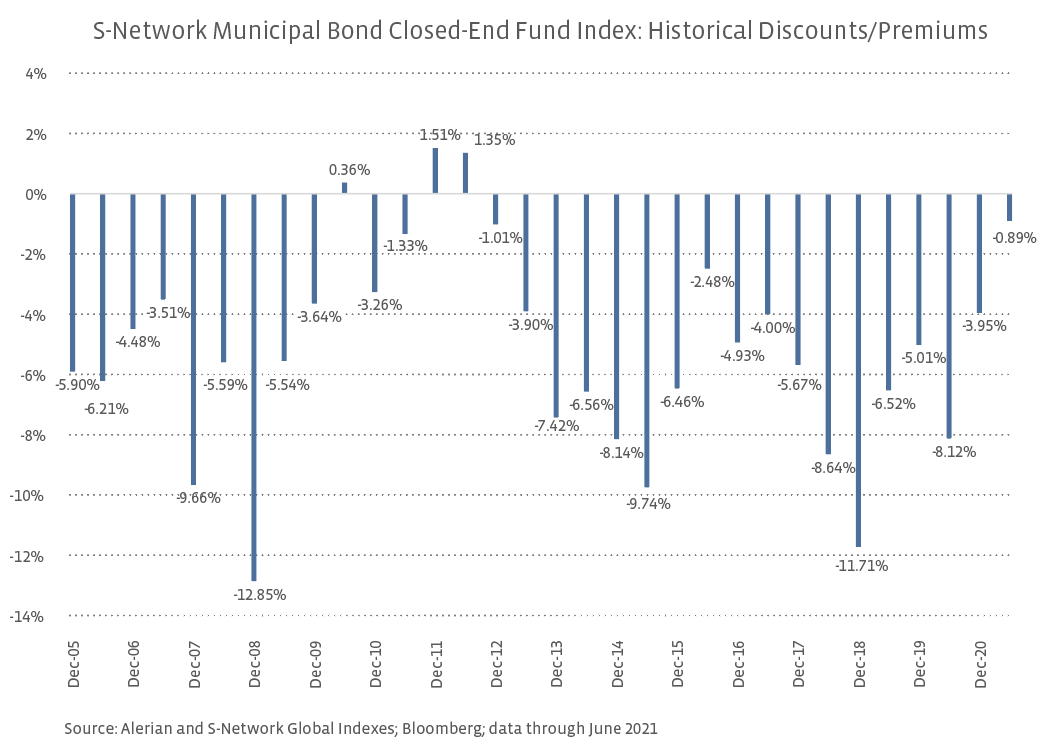
Because of an extended period of demand, valuations of municipal bond CEFs have become more expensive, and many are now trading at record premiums. As of September 22, 2021, CEFMX was trading at essentially a 0% discount (NAV is equivalent to price). Historically, the index has traded at much wider discounts (see graph below). But market prices have recently matched or outperformed NAVs due to higher demand for both tax-free income and higher distributions. Buying closed-end funds at a premium can be concerning for several reasons—1) discounts could widen rapidly during a negative credit event, 2) a rise in interest rates could cause a decline in the portfolio assets (especially given the longer duration nature of municipal holdings, which is further amplified by leverage), and 3) yields are lower when CEFs are bought at a premium rather than a discount. However, municipal bond CEF distributions (recently averaging near 4.2% for CEFMX) are still relatively attractive given low yields in other sectors, and investor interest remains strong. The following pages expand on some of the benefits and risks of leverage—a highly discussed, yet misunderstood attribute that deeply affects municipal CEF returns and distributions.
Although many investors are familiar with municipal bonds, some are not as aware of the intricacies of municipal closed-end funds (CEFs). One of the most unique and defining characteristics of closed-end funds is the ability to use leverage. A CEF can borrow additional capital to magnify exposure to its portfolio and potentially increase returns and distributions by earning a spread between interest earnings and leverage costs. As of the end of 2020, 64% of closed-end funds used some form of leverage [Investment Company Institute: Closed-End Funds and Their Use of Leverage: FAQs]. In the S-Network Municipal Bond Closed-End Fund Index (CEFMX), 56 out of 58 constituents use leverage, with an average leverage ratio of approximately 32%. For investors who are attracted to municipal closed-end funds for their higher return and distribution potential, it is important to understand how leverage works and the associated risks.
An Overview of Closed-End Fund Leverage
Closed-end funds can use several different types of leverage, which are often categorized as either regulatory leverage or portfolio leverage. Portfolio leverage is not regulated by the Investment Company Act of 1940. This includes leverage from portfolio investments like tender option bonds, derivatives, and reverse repurchase agreements. Because this form of leverage is not regulated, it is not required to be included as part of the leverage ratio; however, most fund sponsors still report these to be transparent. Typically, fund sponsors use the term “effective leverage” which includes both regulatory leverage and portfolio leverage.
Regulatory (or structural) leverage is the most common type of leverage and is created when the CEF issues debt or preferred shares. (According to the Investment Company Institute (ICI) preferred share assets were 10% of total closed-end fund assets as of December 2020.) Regulatory leverage is subject to limits under the Investment Company Act of 1940. If debt is used, the leverage ratio cannot exceed 33% of total assets (equivalent to an asset coverage ratio of 300%). If preferred stock is used, the leverage ratio cannot exceed 50% total assets (equivalent to an asset coverage ratio of 200%)[U.S. Securities and Exchange Commission: Investment Company Act of 1940]. Because closed-end funds are typically “closed” to investments after the IPO, they maintain a fixed asset base which allows the fund to more easily stay within regulatory limits. This differs from mutual funds, which experience constant inflows and outflows.
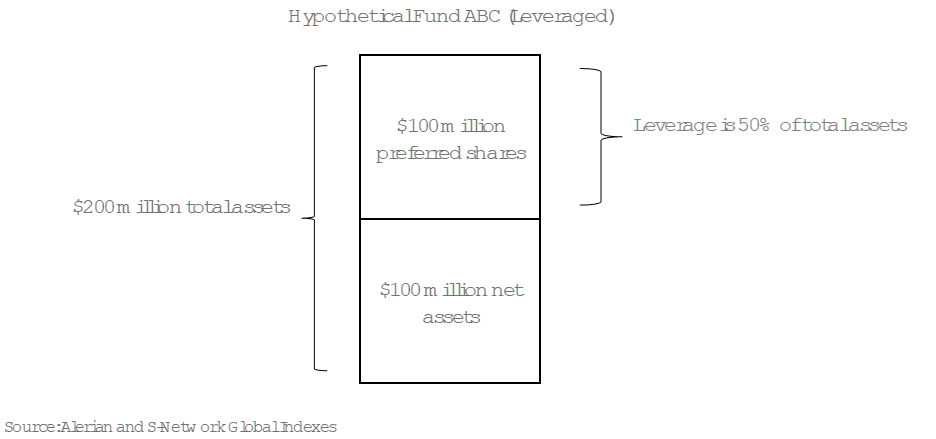
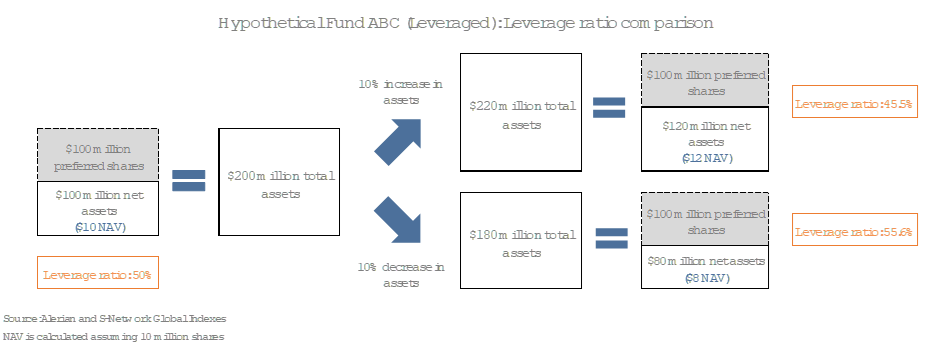
Leverage is calculated on total assets rather than net assets. In the following example, hypothetical fund ABC has a leverage ratio of 50%—leverage consisting of $100 million preferred shares on a total asset base of $200 million.
How does leverage affect NAV?
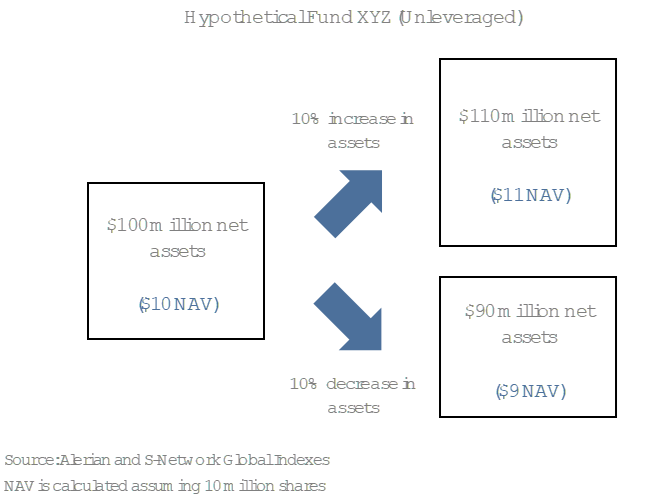
Leverage magnifies the portfolio’s performance—whether it performs positively or negatively. Compared to an unleveraged fund, a leveraged fund’s net asset value (NAV) will benefit more greatly when the market value of the assets increases but also performs more poorly if the market value of the assets decreases. The example below shows a hypothetical unleveraged fund XYZ with an NAV of $10 (based on $100 million net assets and 10 million shares) in two different scenarios. The results are straightforward—if the value of the assets increases 10%, the NAV will also increase 10% from $10 to $11. If the value of the assets falls 10%, the NAV will also fall 10% from $10 to $9.
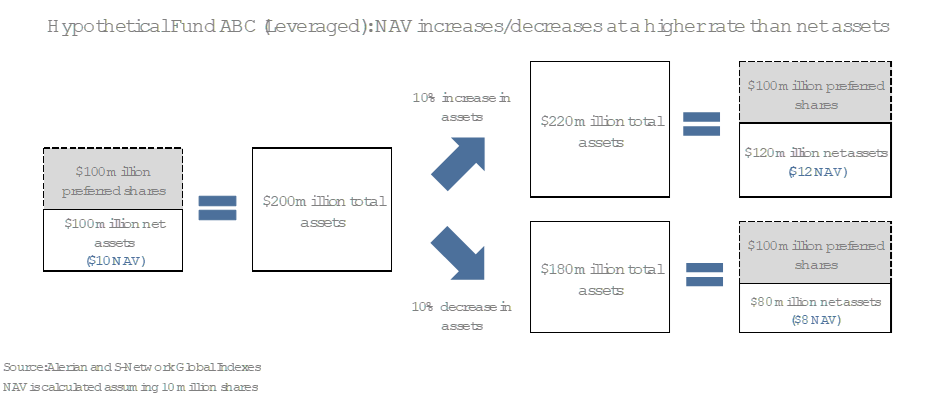
A leveraged fund, however, is more complicated. In the next example, hypothetical fund ABC, which has $100 million of preferred shares (a leverage ratio of 50%). This magnifies the total portfolio exposure, so a 10% increase/decrease in assets would not translate to a 10% increase/decrease in NAV—the results would be more extreme. In this case, if the value of the assets increases 10%, the NAV will increase 20% from $10 to $12. If the value of the assets falls 10%, the NAV will also fall 20% from $10 to $8.
While the actual leverage amount doesn’t typically change, the leverage ratio can change often since the value of the net assets changes with the market. For instance, if interest rates rise then bond prices could fall—so the overall NAV of the CEF could decrease if short-term interest rates rise. Since leverage magnifies the portfolio exposure, municipal CEFs tend to have even longer durations when adjusted for leverage and are more sensitive to interest rates. Using the above example with fund ABC, you can see that the leverage ratio started at 50%—the max amount of leverage allowed for preferred shares. Assuming falling interest rates, a hypothetical 10% increase in assets results in a leverage ratio of 45.5%. Assuming rising interest rates, a hypothetical 10% decrease in assets results in a leverage ratio of 55.6%—above the maximum leverage limit.
Under Section 18 of the Investment Company Act of 1940, if a fund is in violation of its leverage ratios (asset coverage ratios), it cannot pay distributions[U.S. Securities and Exchange Commission: Investment Company Act of 1940]. In this case, the fund may be required to sell some assets in order to redeem preferred shares (or pay down debt) to return the leverage ratio to allowable limits. However, any deterioration in assets may also cause a reduction in the distribution, so many fund sponsors like to keep a large cushion on their leverage ratio to avoid this entire situation (i.e., the examples in this note are hypothetical and use simple numbers. In the real world, a fund will likely avoiding having a leverage ratio at the maximum regulatory level).
How does leverage affect distributions?
Much like with NAV, leverage also has the potential to enhance distributions; however, it does create additional risk. As stated above, leverage is often done through issuing preferred shares or debt, which are borrowed at lower short-term rates and invested at a higher rate to earn a spread. (According to ICI, 93% of preferred share assets were floating rate as of year-end 2020.) While short-term rates are important, CEFs are more affected by the overall spread in interest rates. Even if short-term rates rise, a steeper yield curve with higher long-term rates could still benefit CEFs. Additionally, it’s important to remember that municipal CEFs do not directly follow Treasury rates. These leverage costs are instead based on municipal rates like the SIFMA Municipal Swap Index (SIFMA).
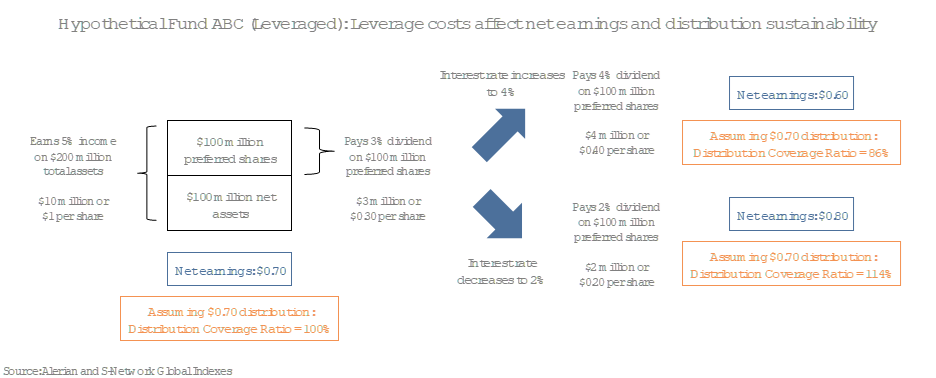
The next example again assumes that hypothetical fund ABC has $100 million net assets and issues $100 million preferred shares (50% leverage ratio). The preferred shares are tied to variable rate financing, and these currently pay a 3% dividend or $0.30 per share—the cost of leverage. The total portfolio earns 5% income, which is equivalent to $1 per share. The spread between earnings and leverage costs is $0.70. We also assume the fund pays a $0.70 distribution, so the distribution coverage ratio (earnings rate/distribution rate) is 100%. Since the variable rate is tied to interest rates, if short-term interest rates increase to 4% and the income rate remains 5%, net earnings would decrease to $0.60 per share. Since net earnings is less than the $0.70 distribution, the distribution coverage falls below 100% and the fund could potentially cut its distribution to a more sustainable level.
Bottom Line:
Municipal bond CEFs are currently experiencing increased demand, partly due to investors searching for higher income products. Higher distributions in municipal bond CEFs are often supported by leverage. Although leverage could help or hurt municipal bond closed-end funds depending on the portfolio’s performance, it is more often the case that leverage is beneficial in the long-term; however, investors should have at least a high-level understanding of how leverage works before investing in CEFs.
The S-Network Municipal Bond Closed-End Fund Index (CEFMX) is the underlying index for the VanEck CEF Muni Income ETF (XMPT).
For more news, information, and strategy, visit the Energy Infrastructure Channel.
Read more on ETFtrends.com.
The views and opinions expressed herein are the views and opinions of the author and do not necessarily reflect those of Nasdaq, Inc.
www.nasdaq.com