
As of 10/29/2021
Economic Overview
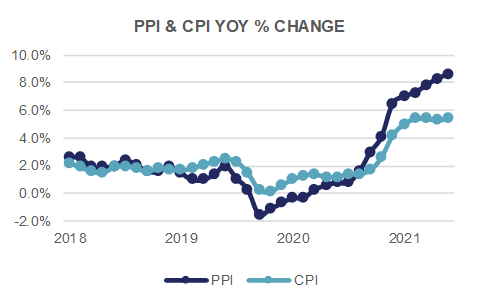
Another month, another hot inflation number. On October 13th, the Year over Year inflation rate (CPI) came in at 5.4%, beating the prior print, and expectations, both of which were 5.3%. Core CPI, which strips out food and energy costs, came in at 4%, which was equal to expectations. The Personal Consumption Expenditure (PCE) measure of inflation came in at 4.4%, higher than the prior month’s 4.2%.
[wce_code id=192]
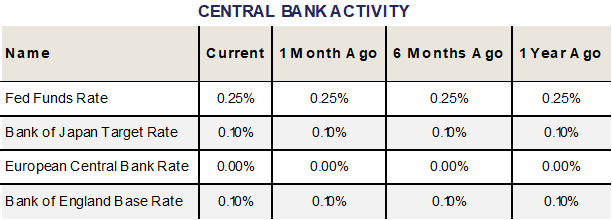
The Federal Reserve is expected to begin Tapering its asset purchases (QE) prior to year-end 2021, tacitly admitting that inflation is less transitory than they predicted. They have committed to fully exiting asset purchases prior to raising interest rates. Even assuming a fairly aggressive taper timeline, this makes it unlikely that interest rate increases are likely prior to mid to late 2022.
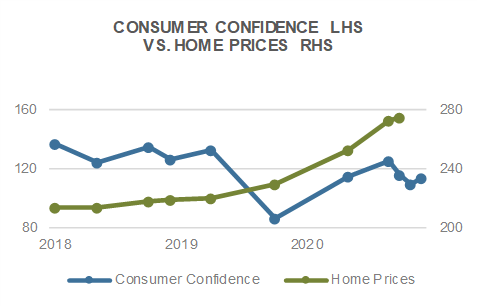
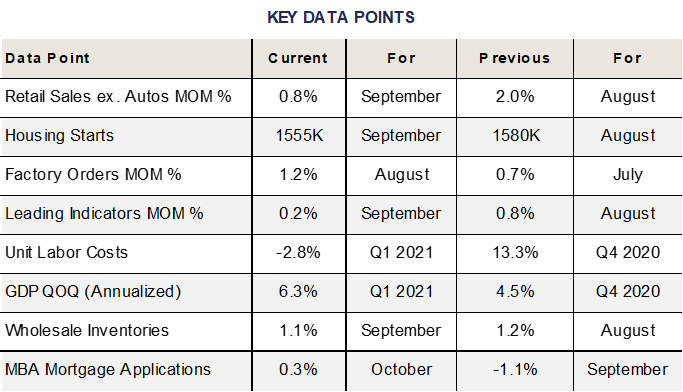
Housing Starts declined by -1.6% from the prior month’s reading, coming in below expectations. This is likely influenced by the widely experienced supply chain issues and labor shortages in construction. New home sales jumped 14% to an annual rate of 800,000 – beating the prior month and the consensus.
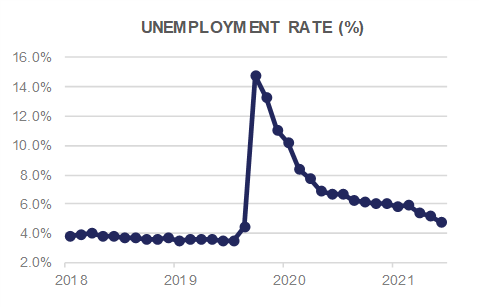
The unemployment rate dropped from 5.2% to 4.8%, beating estimates of 5.1%. It currently stands at the lowest rate since March 2020, although significantly higher than the 3.5% pre-pandemic rate.
Third quarter GDP growth came in at 2%, significantly below the 6.7% growth achieved in the second quarter of 2021. The consensus expectation was for 2.7% growth, so the result was underwhelming, but also a bit of a relief. There was significant dispersion within expectations, with some accounting for a potentially negative print, signaling quarter over quarter economic contraction. Fortunately, this was not the case, but with ongoing labor market shortages, supply chain issues, and the likely reduction of monetary policy support, it will continue to be watched closely.
Personal consumption declined significantly, falling from 12% in the second quarter to 1.6% in the third quarter. Spending on goods fell, particularly on motor vehicles and parts.
The Employment Cost Index, released by the Bureau of Labor Statistics, showed compensation costs for civilian workers increasing by 1.3% (the largest jump in 31 years), well above the 0.9% expected. This is a potential driver of continued inflation, and needs to be watched closely. Many business have held off increasing compensation as long as they could, waiting for labor to become more plentiful. It appears, they may have been pushed to the breaking point.
Domestic Equity
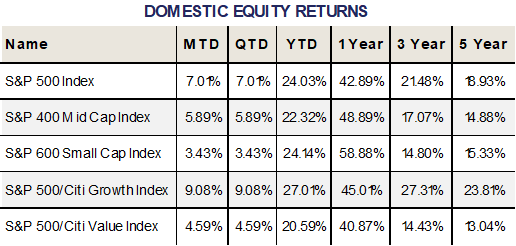
U.S. equities rebounded sharply from September’s losses to post positive gains up and down the risk spectrum in October. The benchmark S&P 500 Index closed at a new all-time high to close the month at 4,605, representing a +7.01% gain during the period. U.S. Large-Caps are now up an impressive +24.03% for the year. Mid- and Small-Caps, as measured by the S&P 400 and 600 Indices also posted gains on the month, rising +5.89% and +3.43%, respectively. For the year, Mid- and Small-Caps have returned +22.32% and +24.12%, respectively.
Growth stocks continued to outpace Value stocks on the month, with the S&P 500 Citi Growth Index gaining +9.08% compared to the S&P 500 Citi Value Index’s +4.59% gain. The outperformance was broad based, but helped by Growth heavyweights Microsoft, which closed October as the world’s most valuable company (overcoming Apple) with a market capitalization of $2.5 Trillion, and Alphabet (Google). Microsoft and Google continue to benefit from favorable trends in cloud computing and advertising revenue spend. Facebook (or Meta Properties with its recent name change) on the other hand reported a weak quarter, impacted significantly by Apple’s privacy policy change. Apple and Amazon also reported mixed earnings reports, with Apple citing weakness in supply chains (a continuing covid-19 theme) and Amazon citing tight labor conditions for its miss. Notably, Apple’s quarter was not a story of weak demand, but rather of weak supply, whereas Amazon’s comments on the labor market are perhaps more impactful as the largest employer in the country looks to hire more than 100,000 workers heading into the holidays. All in all, the collective FAAMG (Facebook, Apple, Amazon, Microsoft, Google) cohort ended the month returning -4.66%, +5.87%, +2.66%, +17.63%, and +10.75%, respectively. Next month we’ll come up with a new acronym to incorporate Meta…
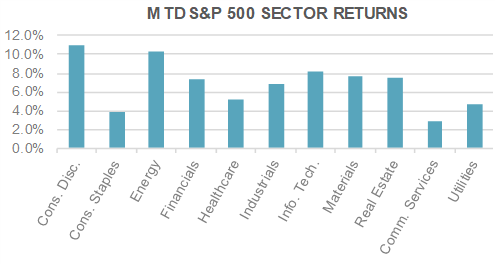
Value stocks rose in sympathy with the market, but underperformed despite marginally higher interest rates. The underlying sector composition was mixed, however, with Financials outperforming, up +7.30% on the month due to higher rates and a steeper yield curve, and both Utilities & Consumer Staples underperforming, up +4.73% and +3.89%, respectively. Energy was a standout, +10.36% on the month, but with its weight in the S&P 500 a non-impactful 2.78%, it’s hard for energy to move the needle at the index level.

International Equity
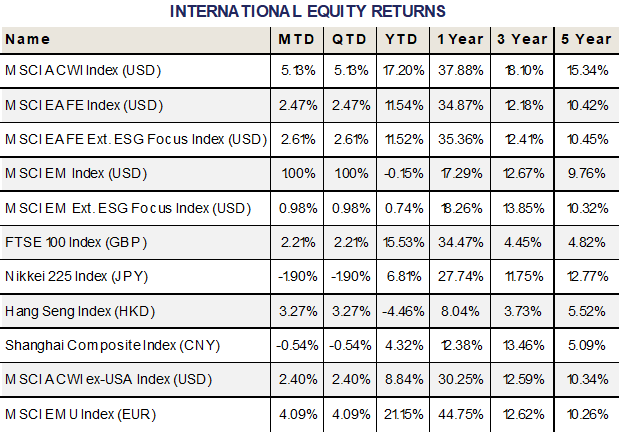
International equities posted positive returns in October, helping the MSCI All Country World Index (ACWI), gain +5.13% during the period. ACWI serves as a widely used benchmark for approximately 85% of the global investable universe, covering the U.S., and both Developed Markets (MSCI EAFE) and Emerging Markets (MSCI EM) on the international front. For the year, MSCI ACWI is up +17.20%.
Developed Markets posted gains of +2.47% in October, helped by the Eurozone, as measured by the MSCI EMU Index, which gained +4.09% in EUR terms on the month, helping to offset weakness in Japan. Japanese equities, as measured by the Nikkei 225 Index lost -1.90% during the period in JPY terms (-4.18% in USD terms) as sentiment in Japan has cooled. UK equities, as measured by the FTSE 100 Index returned +2.21% in GBP terms (+3.82% in USD) ahead of the COP26 climate conference in Scotland.
Emerging Markets were buoyed by the rise in global equities as a whole, gaining only +1.00% on the month, lagging most major global equity benchmarks. For the year, Emerging Markets are down -0.15%, representing a significant underperformance versus Developed Markets and US equities, after a robust 2020 performance coming out of the pandemic. China’s economic data continues to slow and remains weak, dampening Emerging Markets overall, of which China represents more than a third of the overall market capitalization. Emerging Markets ex- China, as measured by the MSCI EM Ex China Index returned -0.13% during the month, and is up +8.66% year to date, highlighting the diverging paths of China and the rest of Emerging Markets. It should be noted that even excluding China, Emerging Markets have lagged their Developed Market counterparts. It remains to be seen if China will alter its zero tolerance stance towards covid-19 to help cushion their slowing economy, or whether the Peoples Bank of China (PBOC) will be able to cut rates given rising inflation should the economy slow further. While much of this is likely already priced into Chinese and Emerging Markets equities, it still represents a significant risk to the global economy.
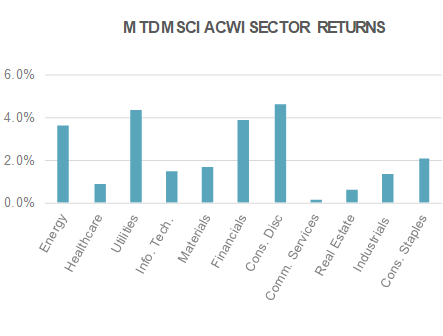
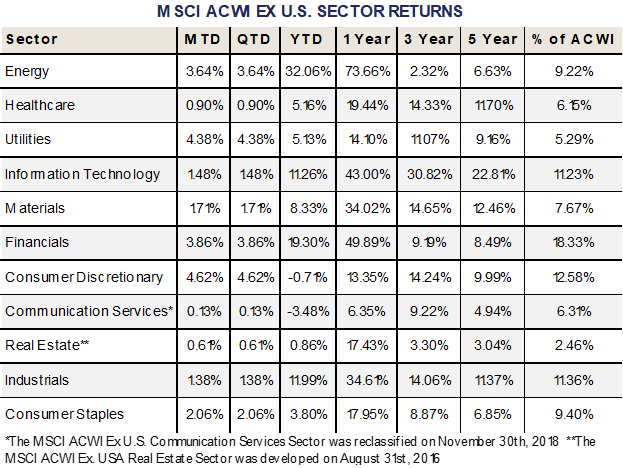
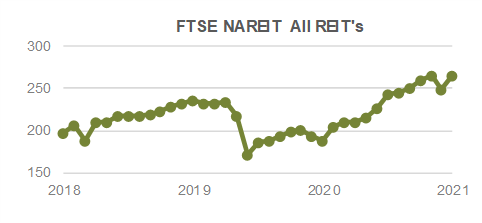
At the sector level, Consumer Discretionary and Utilities were top performers, gaining +4.62% and +4.38%, respectively. Consumer Discretionary stocks have risen in tandem on a global basis as consumers everywhere remain flush with cash and demand remains firm. Real Estate and Communication Services were the two bottom performers, gaining +0.61% and +0.13%, respectively.
Fixed Income
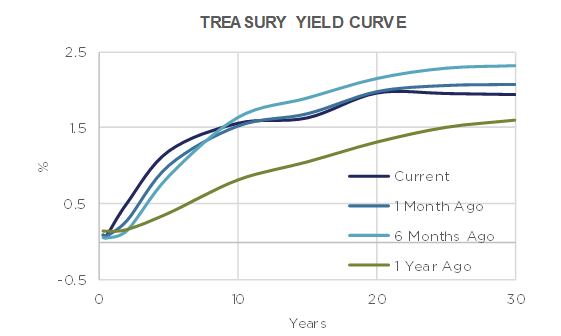
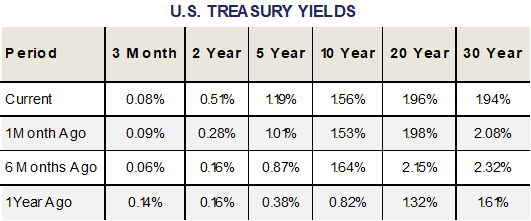
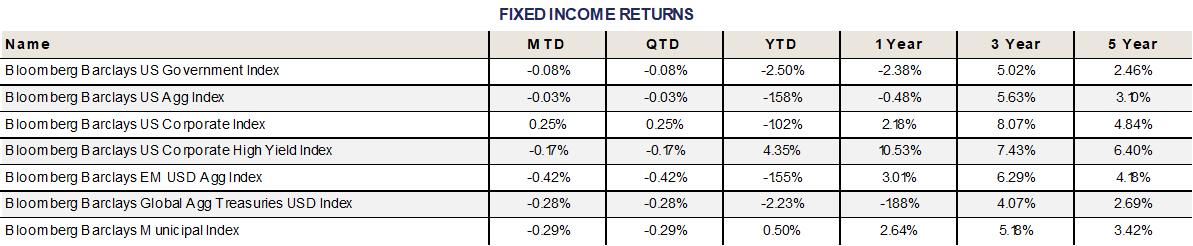
During October, the markets became a little less accepting of the transitory inflation story, and began pricing in the coming Tapering of QE by the Federal Reserve. We saw short and intermediate maturity yields move higher, in preparation of reduced Fed asset buying, and potentially, interest rate increases (although the Fed has pledged to hold off on interest rate adjustments until QE purchases have completely ended, which is likely no sooner than mid-2022).
Further out on the curve, we have seen some flattening, with the 30 year Treasury bond yield declining from a month ago. This can be explained by extrapolating the Fed tightening (Taper/Interest Rate Increase) concerns. If the Fed is too aggressive in its removal of supportive Monetary Policy, it could slow economic growth enough to cause a recession, which would typically cause interest rates to decline. The falling 30 year Treasury yield may be anticipating aggressive Fed action.
As you might expect, assets offering the least amount of yield were impacted the most by this shift in market expectations. Government bond indices, both Federal and Municipal, posted negative returns for the month of October. Even with this recent pullback, Municipal bonds continue to offer the second best performance YTD.
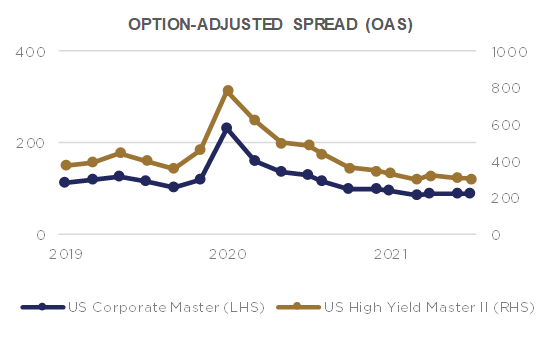
Investment Grade corporate bonds had a relatively strong month, a result of their slightly higher yields, and some spread tightening, which supports prices and offsets the impact of higher rates on the short-end.
High Yield corporate bonds also benefit from higher coupon income to offset the price impact of higher rates, but they did not benefit from a tailwind of tighter spreads. Instead, High Yield spreads widened, which compounded the negative price impact of higher rates, and left the category with a negative return for the month. Year to Date, though, High Yield remains the clear winner. The economic expansion combined with loose Monetary and Fiscal Policy has been a boon to these lower credit quality companies. Global and Emerging Market fixed income allocations have continued to struggle as rates come off historic lows.
Alternative Investments
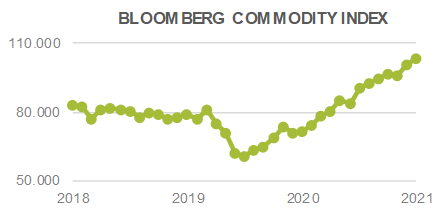
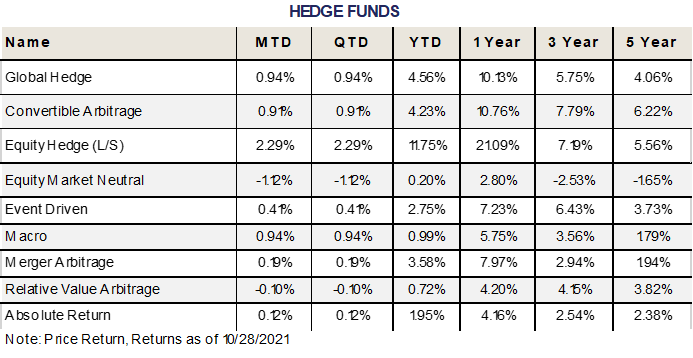
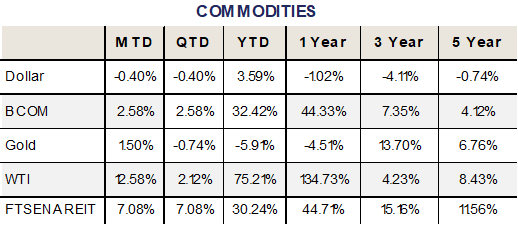
Alternative Investments were mainly positive in October. Risk on sentiment returned with global equities and broad commodities posting strong returns after a weaker third quarter. Commodities, as measured by the Bloomberg Commodity Index, rose +2.58% during the month.
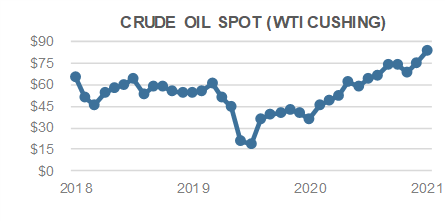
A global energy crunch has caused energy prices to skyrocket in 2021 and threaten the global economic recovery. Natural gas prices have soared to record highs in Europe as demand has grown due to irregular weather and because of the “cleaner” reputation of natural gas compared to coal and oil. More production is needed especially as Europe heads to winter months where natural gas plays a crucial role in heating homes and inventories are below average.
US natural gas production fell last year as lower oil prices caused operators to reduce spending on drilling. The timing of decreased production with increased demand this year due to the global economic recovery has pushed up prices. The use of coal as a substitute has surprisingly increased this year as a response to the energy shortage after years of declining use. This use should be a relatively short phenomenon as the long-term trends still support a declining use of coal in the Green energy transition.
Oil prices have also surged this year, with the WTI Crude Oil Index rising +75.21% YTD. A similar supply/demand imbalance exists in oil markets causing US consumers to feel the pain as higher prices are passed on to the gas pump. OPEC and US oil companies have been hesitant to ramp up production too much in response so far.
The first US listed ETF linked to the price of bitcoin was launched in October. The ETF is only based on bitcoin futures instead of the direct price of bitcoin but the ETF still saw massive inflows, reaching over $1 Billion in assets in the first few days of trading. This relatively new asset class will require further monitoring but the approval of this launch by the SEC was an interesting step in the crypto regulatory landscape.
ESG
A big announcement by the Department of Labor this month – on October 14th the DOL published a notice in the Federal Register regarding the investment consideration of Environmental, Social, and Governance concerns/data within Retirement Plans.
Shifting considerably from the prior guidance on ESG considerations in Retirement Plan investments, “the proposal makes clear that climate change and other ESG factors are often material and that in many instances fiduciaries…should consider climate change and other ESG factors in the assessment of investment risks and returns.”
The proposed rule does not supersede or reduce ERISA’s two key fiduciary duties of loyalty and prudence, but expands the regulatory safe harbor under which an investment decision can be deemed prudent, to include, “the economic effects of climate change and other environmental, social, or governance factors on the particular investment or investment course of action.”
These changes to the Department of Labor’s stance regarding ESG integration will have a significant affect on the types of funds and strategies that are accessible by Retirement Plan participants, and may increase participation and deferral rates by younger participants, who are most interested in these types of investment strategies.
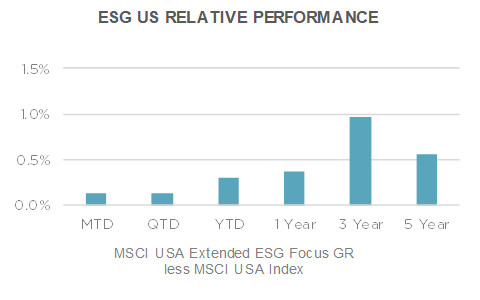
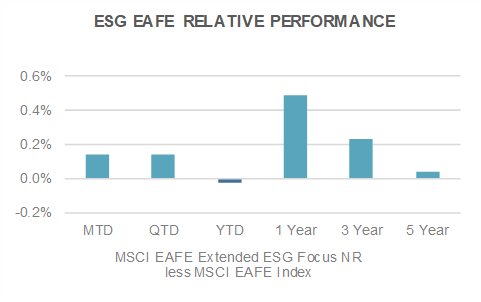
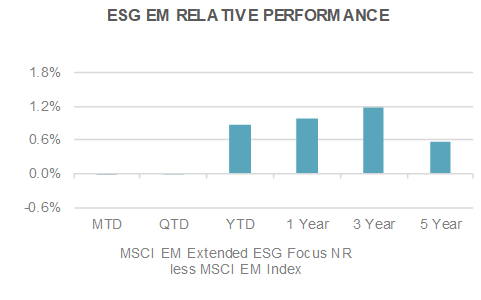
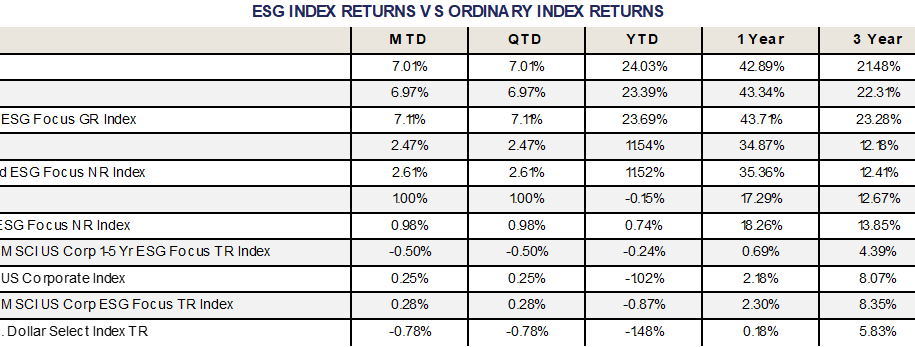
October returns for the ESG equity indices posted a nice recovery, with both the U.S. and EAFE ESG allocations outperforming their respective bencmarks by 14 basis points. Emerging Markets came in about flat, trailing the benchmark by 2 basis points.
The ESG aligned U.S. index outperformed its counterpart in the month and quarter, and is back on track with all time periods flashing green – additive to performance.
ESG integrated EAFE returns contributed positively in October, outperforming the benchmark. YTD is almost flat (marginal drag), but all longer time periods are now positive. This is something that we have been watching closely, as the results had been a bit mixed in the past, but are now strongly supportive of ESG integration.
Emerging Markets had the toughest time in October, but only marginally underperformed the non-ESG integrated benchmark. All longer time horizons continue to strongly support ESG integration into Emerging Markets portfolios.
ESG integrated Investment Grade corporate bonds outperformed by 3 basis points this month. All longer time periods continue to show outperformance and remain very supportive of ESG integration in the space.
If you have any questions or comments, please feel free to contact any member of our investment team:
PORTFOLIO MANAGERS
| Tom Quealy, Chief Executive Officer – [email protected] |
| Larry Whistler, CFA, President & Chief Investment Officer – [email protected] |
| Matthew Krajna, CFA, Co-Chief Investment Officer, Director of Equity Research, and Senior Portfolio Manager – [email protected] |
| Tim Calkins, CFA, Senior Portfolio Manager/ Director of Fixed Income – timothy.ca I ki [email protected] |
| Mike Skrzypczyk, CFA, Senior Trader/ Associate Portfolio Manager [email protected] |
| Ryan Flynn, Trading Associate – [email protected] |
| NEW YORK OFFICE PH: 716-633-3800 FAX: 716-633-3810 100 Corporate Parkway Suite 338 Amherst, NY 14226 |
FLORIDA OFFICE PH: 800-281-8974 4400 PGA Boulevard Suite 404 Palm Beach Gardens, FL 33410 |
| S&P 500 Index (SPX) – Standard and Poor’s 500 Index is a capitalization-weighted index of 500 stocks. The index is designed to measure performance of the broad domestic economy through changes in the aggregate market value of 500 stocks representing all major industries. S&P 500 Sector Indices (S5COND, S5CONS, S5ENRS, S5FINL, S5HL TH, S5INDU, S5INFT, S5MA TR, S5TELS, S5UTIL, S5RLST) – The S&P 500 is broken down into eleven sub-indices according to the Global Industry Classification Standard (GICS) sectors. These eleven sectors include Consumer Discretionary, Consumer Staples, Energy, Financials, Health Care, Industrials, Information Technology, Materials, Communication Services, Utilities, and Real Estate. S&P 400 Mid Cap Index (MID) – Standard and Poor’s Mid Cap 400 Index is a capitalization-weighted index, which measures the performance of the mid-range sector of the U.S. stock market. S&P 600 Small Cap Index (SML) – Standard & Poor’s Small Cap 600 Index is a capitalization-weighted index that measures the performance of selected U.S. stocks with a small market capitalization. S&P 500/Citigroup Growth Index (SGX) – The S&P 500/Citigroup Growth Index is a market capitalization weighted index. All the stocks in the underlying parent index are allocated into value or growth. Stocks that do not have pure value or pure growth characteristics have their market caps distributed between the value & growth indices. S&P 500/Citigroup Value Index (SVX) – The S&P 500/Citigroup Value Index is a market capitalization-weighted index. All the stocks in the underlying parent index are allocated into value or growth. Stocks that do not have pure value or pure growth characteristics have their market caps distributed between the value & growth indices. MSCI AC World Index (MXWD) – The MSCI AC World Index is a free float-weighted equity index. The index includes both emerging and developed world markets. MSCI EAFE Index (MXEA) – The MSCI EAFE Index is a capitalization-weighted index that monitors the performance of stocks from developed markets in Europe, Australia-Asia, and the Far East. MSCI Emerging Market Index (MXEF) – The MSCI Emerging Market Index is a free-float weighted index that is designed to measure the equity performance of international emerging markets. FTSE 100 Index (UKX) – The FTSE 100 Index is a capitalization weighted index of the 100 most highly capitalized companies traded on the London Stock Exchange. The equities use an investability quotient weighting in the index calculation. Nikkei 225 Stock Average Index (NKY) – The Nikkei-225 Stock Average is a price-weighted average of 225 top-rated Japanese companies listed in the First Section of the Tokyo Stock Exchange. |
Hang Seng Index (HSI) – The Hang Seng is a free-float capitalization-weighted index of selected companies from the Stock Exchange of Hong Kong. The components of the index are divided into four sub-indexes: Commerce and Industry, Finance, Utilities, and Properties. Shanghai Stock Exchange Composite Index (SHCOMP) – The Shanghai Stock Exchange Composite Index is a capitalization weighted index. The index tracks the daily price performance of all A-shares and B-shares listed on the Shanghai Stock Exchange. MSCI USA Extended ESG Focus Index – The Index is designed to maximize exposure to positive environmental, social and governance (ESG) factors while exhibiting risk and return characteristics similar to those of the MSCI USA Index. MSCI EAFE Extended ESG Focus Index – The Index is designed to maximize exposure to positive environmental, social and governance (ESG) factors while exhibiting risk and return characteristics similar to those of the MSCI EAFE Index. MSCI Emerging Markets Extended ESG Focus Index – The Index is designed to maximize exposure to positive environmental, social and governance (ESG) factors while exhibiting risk and return characteristics similar to those of the MSCI Emerging Markets Index. MSCI ACWI ex USA Index (MXWDU) – The MSCI ACWI ex USA Index is a free-float weighted index. MSCI ACWI ex USA Sector Indices – The MSCI ACWI ex USA Index is broken down into eleven sub-indices according to the Global Industry Classification Standard (GICS) sectors. These eleven sectors include Consumer Discretionary, Consumer Staples, Energy, Financials, Health Care, Industrials, Information Technology, Materials, Communication Services, Utilities, and Real Estate. MSCI EMU Index (MXEM) – The MSCI EMU (European Economic and Monetary Union) Index is a free-float weighted equity index. Bloomberg Barclays Global Treasuries USD Hedged Index (LGTRTRUH) – The Bloomberg Barclays Global Treasury Index tracks fixed-rate, local currency government debt of investment grade countries. The index represents the treasury sector of the Global Aggregate Index and contains issues from 37 countries denominated in 24 currencies. Bloomberg Barclays Municipal Bond Index (LMBITR) – The Bloomberg Barclays Municipal Bond Index covers the USD denominated long-term tax exempt bond market. The index has four main sectors: state and local general obligation bonds, revenue bonds, insured bonds, and pre-refunded bonds. Bloomberg Barclays U.S. Government Index -Bloomberg Barclays US Government Bond Index is compromised of the US Treasury and US Agency Indices. The index includes US dollar-denominated, fixed-rate, nominal US Treasuries and US agency debentures (securities issued by US government owned or government sponsored entities, and debt explicitly guaranteed by the US government). |
Bloomberg Barclays EM Hard Currency Aggregate Index (LG20TRUU) – The Bloomberg Barclays Emerging Markets Hard Currency Aggregate Index is a hard currency Emerging Markets debt benchmark that includes USO-denominated debt from sovereign, quasi-sovereign, and corporate EM issuers. Bloomberg Barclays U.S. Aggregate Bond Index (LBUSTRUU) – The Bloomberg Barclays US Aggregate Bond Index is a broad-based benchmark that measures the investment grade, US dollar-denominated, fixed-rate taxable bond market. The index includes Treasuries, government-related and corporate securities, MBS (agency fixed-rate and hybrid ARM pass-through), ABS and CMBS (agency and non-agency). Bloomberg Barclays U.S. Corporate Index (LUACTRUU) – The Bloomberg Barclays US Corporate Bond Index measures the investment grade, fixed-rate, taxable corporate bond market. It includes USD denominated securities publicly issued by US and non-US industrial, utility and financial issuers. Bloomberg Barclays U.S. Corp High Yield Index (LFTR ML U.S. Corporate Index (COAO) – The Bloomberg Barclays US Corporate High Yield Bond Index measures the USD denominated, high yield, below-investment grade fixed-rate corporate bond market. S&P Green Bond Select Index (SPGRSLL T) -The S&P Green Bond Select Index is a market value-weighted subset of the S&P Green Bond Index that seeks to measure the performance of green-labeled bonds issued globally, subject to stringent financial and extra-financial eligibility criteria. ML U.S. Corporate Index (C0A0) – The Merrill Lynch U.S. Corporate Index tracks the performance of U.S. dollar denominated investment grade corporate debt publicly issued in the U.S. domestic market. ML U.S. High Yield Index (H0A0) – The Merrill Lynch U.S. High Yield Index tracks the performance of U.S. dollar denominated below investment grade corporate debt publicly issued in the U.S. domestic market. FTSE NAREIT All REITs Index (FNAR) – The FTSE NAREIT All REITs Index is a free float adjusted market capitalization-weighted index that includes all tax qualified REITs listed in the NYSE, AMEX, and NASDAQ National Market. Bloomberg Commodity Index (BCOM) -Bloomberg Commodity Index (BCOM) is calculated on an excess return basis and reflects commodity futures price movements. The index rebalances annually weighted 2/3 by trading volume and 1/3 by world production and weight-caps are applied at the commodity, sector and group level for diversification. Roll period typically occurs from 6th-10th business day based on the roll schedule. U.S. Dollar Index (DXY) – The U.S. Dollar Index (USDX) indicates the general int’I value of the USD. The USDX does this by averaging the exchange rates between the USD and 6 major world currencies. The ICE US computes this by using the rates supplied by some 500 ba |
| HFRX Global Hedge Fund Index (HFRXGL) -The HFRX Global Hedge Fund Index is designed to be representative of the overall composition of the hedge fund universe. It is comprised of all eligible hedge fund strategies. HFRX Convertible Arbitrage Index (HFRXCA) – The HFRX Convertible Arbitrage Index is designed to reflect the general performance of strategies in which the investment thesis is predicated on realization of a spread between related instruments in which one or multiple components of the spread is a convertible fixed income instrument. HFRX Distressed Securities Index (HFRXDS) -The HFRX Distressed Securities Index is designed to reflect the general performance of strategies focused on corporate fixed income instruments, primarily on corporate credit instruments of companies trading at significant discounts to their value at issuance of obliged (par value) at maturity as a result of either formal bankruptcy pro HFRX Macro Index (HFRXM) – The HFRX Macro Index reflects the general performance of strategies in which the investment process is predicated on movements in underlying economic variables and the impact these have on equity, fixed income, hard currency, and commodity markets. HFRX Equity Hedge Index (HFRXEH) – The HFRX Equity Hedge Index is designed to reflect the general performance of strategies that maintain both long and short positions in primarily equity and equity derivative securities. A wide variety of investment processes can be employed to arrive at an investment decision, including both quantitative and fundamental techniques. Strategies can be broadly diversified or narrowly focused. HFRX Equity Market Neutral Index (HFRXEMN) – The HFRX Equity Market Neutral Index is designed to reflect the general performance of strategies that employ sophisticated quantitative techniques of analyzing price data to ascertain information about future price movement and relationships between securitie |
HFRX Event Driven Index (HFRXED) – The HFRX Event Driven Index reflects the general performance of strategies that maintain positions in companies currently or prospectively involved in corporate transactions of a wide variety including, but not limited to, mergers, restructurings, financial distress, tender offers, shareholder buybacks, debt exchanges, security issuance, or other capital structure adjustments. HFRX Merger Arbitrage Index (HFRXMA) -The HFRX Merger Arbitrage Index reflects the general performance of strategies which employ an investment process primarily focused on opportunities in equity and equity related instruments of companies which are current engaged in a corporate transaction. HFRX Relative Value Arbitrage Index (HFRXRVA) – The HFRX Relative Value Arbitrage Index reflects the general performance of strategies that maintain positions in which the investment thesis is predicated on realization of a valuation discrepancy in the relationship between multiple securities. |
Economic Data Sources: PPI & CPI – Bureau of Labor Statistics Unemployment Rate – Bureau of Labor Statistics Consumer Confidence – Conference Board SP/Case-Shiller Composite 20 – Case-Shiller Industrial Production – Federal Reserve Capacity Utilization – Federal Reserve Retail Sales – U.S. Census Bureau Housing Starts – U.S. Department of Commerce Factory Orders – U.S. Census Bureau Leading Indicators – Conference Board Unit Labor Costs – Bureau of Labor Statistics GDP – Bureau of Economic Analysis Wholesale Inventories – U.S. Census Bureau MBA Mortgage Applications – Mortgage Bankers Association 4-Week Moving Average of Initial Claims, SA – Bureau of Labor Statistics |
Nottingham Advisors, Inc. (“Nottingham”) is an SEC registered investment adviser with its principal place of business in the State of New York. Nottingham and its representatives are in compliance with the current registration requirements imposed upon registered investment advisers by those states in which Nottingham maintains clients. Nottingham may only transact business in those states in which it is registered, or qualifies for an exemption or exclusion from registration requirements. This material is limited to the dissemination of general information pertaining to Nottingham’s investment advisory/management services. Any subsequent, direct communication by Nottingham with a prospective client shall be conducted by a representative that is either registered or qualifies for an exemption or exclusion from registration in the state where the prospective client resides.
The information contained herein should not be construed as personalized investment advice. Past performance is no guarantee of future results. Information contained herein should not be considered as a solicitation to buy or sell any security. Investing in the stock market involves the risk of loss, including loss of principal invested, and may not be suitable for all investors. This material contains certain forward-looking statements which indicate future possibilities. Actual results may differ materially from the expectations portrayed in such forward-looking statements. As such, there is no guarantee that any views and opinions expressed in this letter will come to pass. Additionally, this material contains information derived from third party sources. Although we believe these sources to be reliable, we make no representations as to the accuracy of any information prepared by any unaffiliated third party incorporated herein, and take no responsibility therefore. All expressions of opinion reflect the judgment of the authors as of the date of publication and are subject to change without prior notice. Past performance is not an indication of future results.
The indices referenced in the Nottingham Monthly Market Wrap are unmanaged and cannot be invested in directly. The returns of these indices do not reflect any investment management fees or transaction expenses. Had these additional fees and expenses been reflected, the returns of these indices would have been lower. Information herein has been obtained from third party sources that are believed to be reliable: however, the accuracy of the data is not guaranteed by Nottingham Advisors. The content of this report is as current as of the date indicated and is subject to change without notice.
For information pertaining to the registration status of Nottingham, please contact Nottingham or refer to the Investment Adviser Public Disclosure web site (www.adviserinfo.sec.gov). For additional information about Nottingham, including fees and services, send for our disclosure statement as set forth on Form ADV from Nottingham using the contact information herein. Please read the disclosure statement carefully before you invest or send money.
PROVING OUR WORTH by building yours
100 Corporate Parkway I Suite 338 I Buffalo, NY 14226 I 716-633-3800 I www.nottinghamadvisors.com
For more news, information, and strategy, visit the ETF Strategist Channel.
Read more on ETFtrends.com.
The views and opinions expressed herein are the views and opinions of the author and do not necessarily reflect those of Nasdaq, Inc.
www.nasdaq.com