
.ASX 200, Asset Allocation, Commodities,RBA, Fed, China - Talking PointsThe ASX 200 is only 7% from all-time highs but obstacles lie aheadRelative pe
.
ASX 200, Asset Allocation, Commodities,RBA, Fed, China – Talking Points
- The ASX 200 is only 7% from all-time highs but obstacles lie ahead
- Relative performance, asset allocation and commodities are weighing
- The ASX 200 has had a decent rally from recent lows, but is it enough?
The ASX 200 index may have seen a peak for the cycle as headwinds continue to grow.
Superannuation asset allocations away from equities, limited commodity upside and tightening monetary conditions are all working against the Australian stock market making a new high.
Australia’s superannuation industry sees net contributions of over AUD 1 billion a week according to the latest data from the Australian Prudential Regulation Authority.
Of this, on average, just over 50% goes toward equities, predominately domestic listed companies.
One of the largest fund managers in the country is the Australian sovereign wealth fund, Future Fund. This week we heard the Chairman, Peter Costello, announce that the fund had exited away from ‘riskier’ assets, including listed equities.
The re-allocation of 2% across their funds meant that just over AUD 4 billion exited this asset class over the last few months.
It said that the decision was triggered by tightening fiscal and monetary policies. None of the other large fund managers have disclosed any re-weightings and nor do they have to.
However, in a game of relative performance, the market will be analysing the decision closely, given the outperformance of the Future Fund since its inception in 2006.
This kind of thinking may explain part of the underperformance of the ASX 200 over the last few months.
Two aspects stand out. In early January, the ASX 200 was unable to eclipse the high that was made in August last year, although it came close. At the same time, over in the US, the S&P 500 went around 8% higher than its August peak.
Secondly, both markets saw falls near 12% from the January summits. Since the sell-off, the S&P 500 has rallied over 8.5% while the ASX 200 has reclaimed just over 5%.
This implies that there could be underlying structural weakness unfolding within the ASX 200.
ASX 200 AND S&P 500 CHART

Chart created in TradingView
The ASX 200 is largely made up of miners and financials. The latter being predominately the four largest banks. With the exception of CBA, they are facing significant fintech challengers but net-net, it probably is not really a driver for the index.
The big miners are a different story as the China backdrop evolves. On the one hand, China is loosening policy at a time when the rest of the world is tightening.
On the other hand, they are easing for a reason. In any case, iron ore and energy commodities appear to have their best prospects in the price for now.
The RBA abandoned their asset purchase program this week but ruled out any imminent rate hikes. They are in the enviable position of having core inflation of 2.6%. Their hand is not being forced, but if conditions continue as they are, rate hikes later this year appear likely.
However, the main game is across the Pacific with the Fed now acknowledging inflation as a problem that it needs to tackle. Extremely loose monetary policy has pumped air into a financial system that teetered in the face of a global pandemic. That situation is now, very slowly, going in reverse.
A bit like turning around the Titanic, it takes time for big decisions to filter through a complex financial system. Particularly when there is vested interest to keep the thing afloat, as there is with the Fed.
Overall, this leads to underlying structural weakness for equity prices, which makes a new high for the ASX 200 appear unlikely. That said, a dramatic crash lower is unlikely.
A more reasonable path to expect, might be that overly inflated prices deflate at a pace that within an acceptable time frame. As individuals, central bankers don’t want to be the people at the helm when panic grips investors.
That means that any significant sell off is likely to be met with policy support. The opportunity could be in the changing of the mantra from ‘buy the dip’ to ‘sell the rally’.
Playing close attention to your preferred technical indicators could the key to your strategy.
ASX 200 Technical Analysis
The ASX 200 has a double top in place. It has moved below the medium and long-term simple moving average (SMA).
It has recently rallied above to 10-day SMA which could indicate there is short term bullish momentum but medium and long term bearish may evolve further.
Pivot points and previous highs might offer resistance at 7145.7, 7340.4, 7487.3, 7620.2 and 7632.8.
On the downside, support may lie at the pivot point of 6917.3 or the prior lows of 6758.2, 6648.6 and 6517.2.
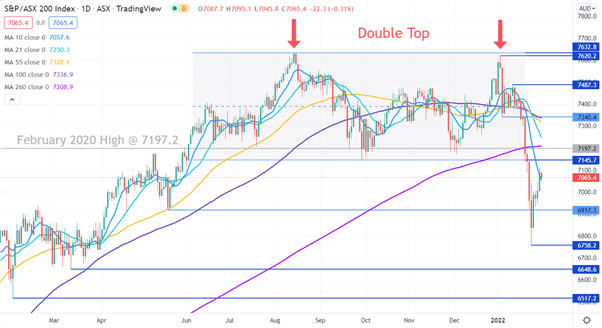
Chart created in TradingView
— Written by Daniel McCarthy, Strategist for DailyFX.com
To contact Daniel, use the comments section below or @DanMcCathyFX on Twitter
element inside the
element. This is probably not what you meant to do!Load your application’s JavaScript bundle inside the element instead.
www.dailyfx.com