
NZD/USD trades below the 50-Day SMA (0.6817) for the first time since February after failing to defend the bullish trend from earlier this year, and
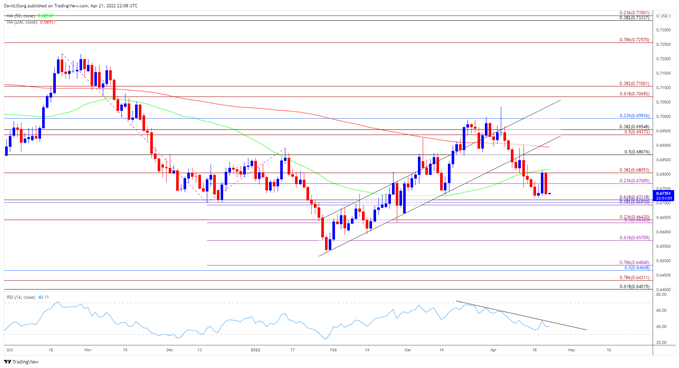
NZD/USD trades below the 50-Day SMA (0.6817) for the first time since February after failing to defend the bullish trend from earlier this year, and the exchange rate may face a further decline over the remainder of the month as it struggles to push back above the moving average.
In turn, the rebound from the monthly low (0.6715) may continue to unravel as NZD/USD fails to extend the series of higher highs and lows from earlier this week, with recent developments in the Relative Strength Index (RSI) casting a bearish outlook as the oscillator establishes a downward trend.
NZD/USD Rate Daily Chart
Source: Trading View
Keep in mind, NZD/USD cleared the opening range for 2022 in March, with the 50-Day SMA (0.6817) establishing a positive slope as the exchange rate traded to a fresh yearly high (0.7034) earlier this month.
However, NZD/USD trades below the 50-Day SMA for the first time since February after failing to defend the bullish trend from earlier this year, with the exchange rate giving back the advance from the monthly low (0.6715) as it struggles to push back above the moving average.
A break/close below the Fibonacci overlap around 0.6690 (38.2% expansion) to 0.6710 (61.8% expansion) brings the 0.6630 (50% expansion) to 0.6630 (23.6% expansion) area on the radar, with the next region of interest coming in around 0.6570 (61.8% expansion).
— Written by David Song, Currency Strategist
Follow me on Twitter at @DavidJSong
element inside the
element. This is probably not what you meant to do!Load your application’s JavaScript bundle inside the element instead.
www.dailyfx.com