
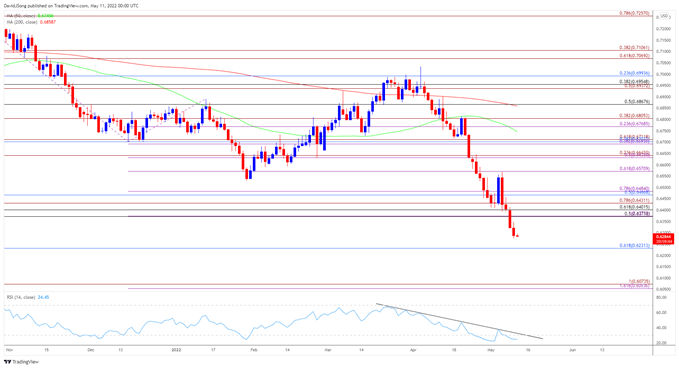
NZD/USD carves a series of lower highs and lows as it trades to a fresh yearly low (0.6276), and the exchange rate may attempt to test the June 2020
NZD/USD carves a series of lower highs and lows as it trades to a fresh yearly low (0.6276), and the exchange rate may attempt to test the June 2020 low (0.6185) as long as the Relative Strength Index (RSI) sits in oversold territory.
At the same time, the RSI has developed a downward trend as it pushes below 30 for the second time in 2022, and the extreme reading in the oscillator is likely to be accompanied by a further decline in NZD/USD like the price action seen earlier this year.
NZD/USD Rate Daily Chart
Source: Trading View
NZD/USD has come under pressure after failing to push back above the 0.6570 (61.8% expansion) region, with the 50-Day SMA (0.6746) now reflecting a negative slope as the exchange rate continues to trade to fresh yearly lows in May.
NZD/USD may continue to carve a series of lower highs and lows over the coming days as the RSI holds below 30, and the bearish momentum looks poised to persist as long as the oscillator retains the downward trend from earlier this year.
A break/close below the 0.6230 (61.8% retracement) area brings the June 2020 low (0.6185) on the radar, with the next area of interest coming in around 0.6050 (161.8% expansion) to 0.6070 (100% expansion).
— Written by David Song, Currency Strategist
Follow me on Twitter at @DavidJSong
element inside the
element. This is probably not what you meant to do!Load your application’s JavaScript bundle inside the element instead.
www.dailyfx.com