
NZD/USD retraces the decline following the US Non-Farm Payrolls (NFP) report as it bounces back from the 200-Day SMA (0.6908), and the exchange rate
NZD/USD retraces the decline following the US Non-Farm Payrolls (NFP) report as it bounces back from the 200-Day SMA (0.6908), and the exchange rate may attempt to test the yearly high (0.6998) as long as it holds above the moving average.
It seems as though the commodity bloc currencies will continue to benefit from the recovery in risk appetite as the Australian Dollar climbs to a fresh yearly high, and NZD/USD may exhibit similar behavior as the 50-Day SMA (0.6772) establishes a positive slope.
NZD/USD Rate Daily Chart
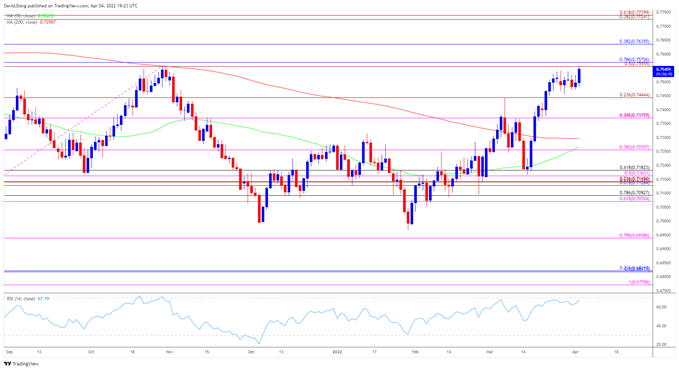
Source: Trading View
NZD/USD may continue to exhibit a bullish trend after clearing the opening range for 2022 in March, with a break/close above the Fibonacci overlap around 0.6940 (50% expansion) to 0.6990 (23.6% retracement) bringing the 0.7070 (61.8% expansion) to 0.7110 (38.2% expansion) area on the radaras it bounces along channel resistance.
A break above the October high (0.7219) opens up the 0.7260 (78.6% expansion) region, but lack of momentum to clear the overlap around 0.6940 (50% expansion) to 0.6990 (23.6% retracement) may push NZD/USD back towards the 0.6870 (50% retracement) region as it lines up with channel support.
However, failure to hold above the 0.6870 (50% retracement) region would largely negate the ascending channel, with a break/close below the 0.6770 (23.6% expansion) to 0.6810 (38.2% expansion) area bringing the March low (0.6729) on the radar.
— Written by David Song, Currency Strategist
Follow me on Twitter at @DavidJSong
element inside the
element. This is probably not what you meant to do!Load your application’s JavaScript bundle inside the element instead.
www.dailyfx.com