NZD/USD carves a series of higher highs and lows after trading to a fresh yearly low (0.6216) earlier this month, and the exchange rate may stage a l
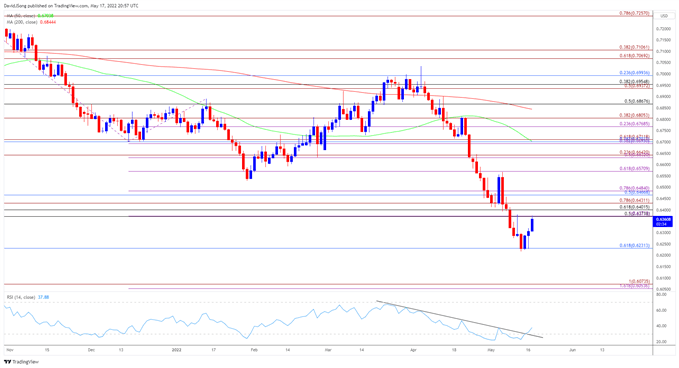
NZD/USD carves a series of higher highs and lows after trading to a fresh yearly low (0.6216) earlier this month, and the exchange rate may stage a large rebound as the three-day rally pulls the Relative Strength Index (RSI) out of oversold territory.
The move above 30 in the RSI is likely to be accompanied by a further advance in NZD/USD like the behavior seen earlier this year, and the bearish momentum may continue to abate as the indicator breaks out of the downward trend from earlier this year.
NZD/USD Rate Daily Chart

Source: Trading View
NZD/USD appears to have reversed course ahead of the June 2020 low (0.6185) as it struggled to close below the 0.6230 (61.8% retracement) region, with recent series of higher highs and lows raising the scope for a larger rebound in the exchange rate as the RSI climbs above 30 to offer a textbook buy signal.
Need a break/close above the Fibonacci overlap around 0.6370 (50% retracement) to 0.6430 (78.6% expansion) to open up the 0.6470 (50% retracement) to 0.6480 (78.6% expansion) region, with the next area of interest coming in around 0.6570 (61.8% expansion), which lines up with the monthly high (0.6568).
However, failure to push above the overlap around 0.6370 (50% retracement) to 0.6430 (78.6% expansion) may generate range bound conditions in NZD/USD as the 0.6230 (61.8% retracement) area appears to be acting as near-term support.
— Written by David Song, Currency Strategist
Follow me on Twitter at @DavidJSong
element inside the
element. This is probably not what you meant to do!Load your application’s JavaScript bundle inside the element instead.
www.dailyfx.com
