US Dollar, EUR/USD, GBP/USD, AUD/USD, USD/CAD Talking Points:The US Dollar is currently threatening a bullish breakout, and given last week’s news
US Dollar, EUR/USD, GBP/USD, AUD/USD, USD/CAD Talking Points:
The US Dollar is currently threatening a bullish breakout, and given last week’s news at the FOMC, it makes sense as to why. The Fed warned of the possibility of faster rate hikes while also sharing that they’re nearly ready to make an announcement on tapering asset purchases. Per Powell, provided that the next jobs report is not disastrous, the Fed may be ready to make such an announcement at their November rate decision.
The next NFP report is on Friday, October the 8th and that data release can provide significant to markets given the backdrop. But, price action in the US Dollar is already set up for breakout potential, as the currency has spent the past few months building an ascending triangle pattern that will often be approached with the aim of bullish breakouts.
The pattern is noted by its horizontal resistance to go along with rising higher-low support. The horizontal resistance comes from this year’s swing highs: The current level of resistance and the price that came into play after the Fed is at 93.43, which was the Q1 swing high. And above that, the 2021 swing high marks the topside of the zone at 93.73.
To learn more about the ascending triangle, check out DailyFX Education
US Dollar Daily Price Chart
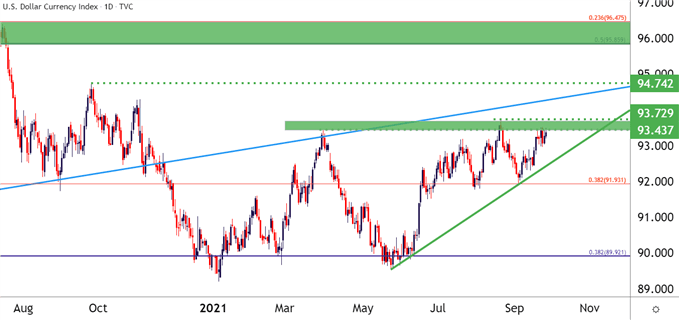
Chart prepared by James Stanley; USD, DXY on Tradingview
EUR/USD Breakdown Potential
If the US Dollar is going to break out from that 2021 resistance, it’s likely going to need at least some help from the Euro. And at this point, EUR/USD is trading around the same support zone that was in play a couple of weeks ago.
So far this year EUR/USD has been similarly range bound with very limited time below the 1.1700 handle. The 2021 swing low currently resides around 1.1664 and breach below that price opens the door for a run down towards the 1.1600 handle. Below that, there’s a longer-term support zone resting in the 1448-1500 zone, banded between a Fibonacci level and a psychological price.
To learn more about Fibonacci or psychological levels, check out DailyFX Education
EUR/USD Daily Price Chart
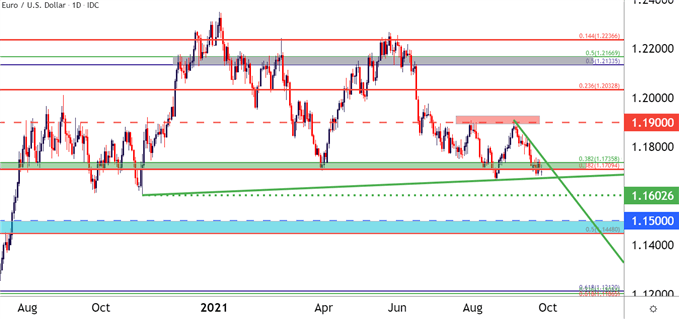
Chart prepared by James Stanley; EURUSD on Tradingview
GBP/USD for USD Fades
For those looking at a resistance hold of the zone looked at above in USD, GBP/USD can remain a compelling option. The Bank of England had a rate decision last week and the BoE may end up raising rates even faster than the Fed, with markets now looking for a 15 basis point move in Q1 of next year.
The current seven-month-low in the pair is at 1.3575, which was set in July, with higher-lows printing in both August and September. A hold of support in this area is key, and there’s another zone of note coming into play between 1.3650-1.3678, each of which are longer-term Fibonacci levels of note that are currently helping to hold higher-low support.
GBP/USD Daily Price Chart
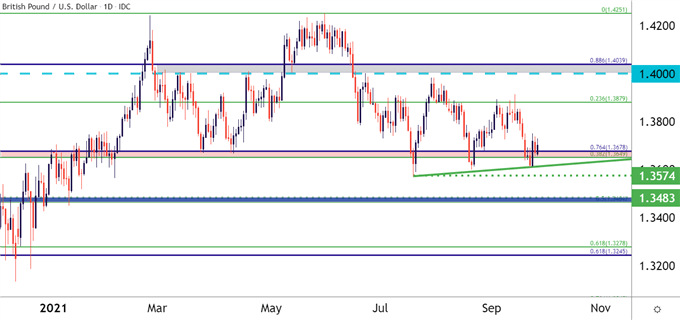
Chart prepared by James Stanley; GBPUSD on Tradingview
USD/JPY Moves Towards Key Resistance
If USD strength does take hold in Q4, the likely culprit would be what the Fed had laid the groundwork for last week, which would be higher rates. This could produce a repeat of the Q1 scenario, as markets hopeful for recovery tried to get in-front of an inevitable move by the Fed that didn’t end up happening until last week, with the bank upgrading their rate forecasts.
That FOMC rate decision has produced a three-day-move in USD/JPY that’s propelled the pair up to a really big spot of resistance, running from a Fibonacci level at 111.61 up to the psychological level of 112.50.
This zone has held the high in the pair for the past three years, starting in 2019 and continuing in 2020 and 2021. A breach of short-term resistance at 110.97 opens the door for a run up to the big zone; but if buyers can break 112.50, then we’re looking at fresh two-to-three year highs in USD/JPY (depending on when it happens) and that can keep the door open to a run up towards the 114.00 handle.
USD/JPY Weekly Price Chart
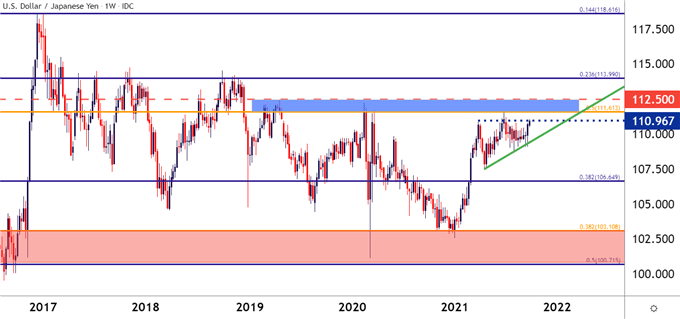
Chart prepared by James Stanley; USDJPY on Tradingview
USD/CAD: Still at Support
I had looked into USD/CAD last week when the pair had re-engaged with a really big support zone. This support is at the topside of a longer-term zone, with the longer-term zone running from 1.2500-1.2632, and the shorter-term zone showing at the very top of that from 1.2621-1.2632.
That support remains in play after the start of this week’s trade, keeping the door open for bulls. In USD/CAD, the scenario would be mean reversion at first as the pair has been range-bound through September trade, so far. Resistance potential exists around 1.2695 and 1.2762.
USD/CAD Four-Hour Price Chart
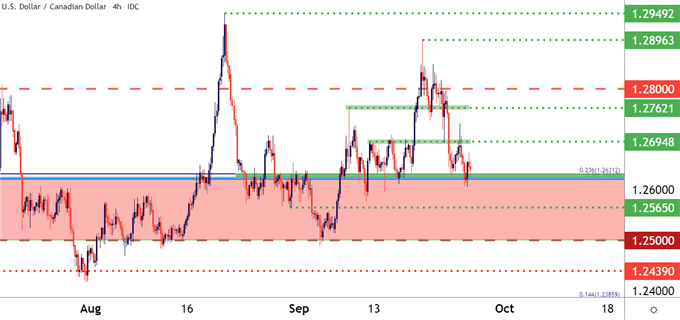
Chart prepared by James Stanley; USDCAD on Tradingview
— Written by James Stanley, Senior Strategist for DailyFX.com
Contact and follow James on Twitter: @JStanleyFX
element inside the
element. This is probably not what you meant to do!Load your application’s JavaScript bundle inside the element instead.
www.dailyfx.com