
US Dollar Price Action Talking Points:The US Dollar put in another topside push to set a fresh yearly high today. There aren’t many other currenci
US Dollar Price Action Talking Points:
- The US Dollar put in another topside push to set a fresh yearly high today.
- There aren’t many other currencies vying for strength at the moment and the big driver behind the USD move is the Euro, which seems to have little hope at the moment.
- The analysis contained in article relies on price action and chart formations. To learn more about price action or chart patterns, check out our DailyFX Education section.
The US Dollar hit another fresh high today and along the way took out my final target from the Q4 technical forecast at 96.47. Making matters more interesting, the same trendline that helped to hold the lows while an ascending triangle was forming in late-Q3 came into play again in late-October to fuel another ascending triangle break.
At this point, the US Dollar is overbought on both a daily and weekly basis via RSI: The bigger question is whether that matters, or perhaps more importantly, when it might matter, as that indicator can get more and more overbought provided proper motivation, which it appears we have at the moment.
US Dollar Daily Price Chart
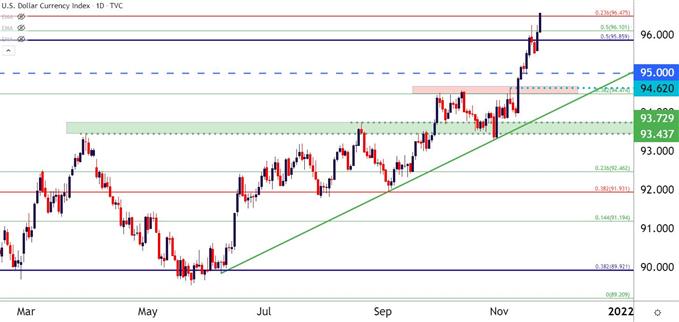
Chart prepared by James Stanley; USD, DXY on Tradingview
EUR/USD: A Possible Nasty Scenario as Price Closes in on a Big Level
As I’ve talked about numerous times over the past couple of months, the US Dollar is going to have a difficult time making any moves without at least some participation from the Euro.
And boy has the Euro participated. The single currency continues to drop like a rock and there’s the makings of a nasty scenario brewing here, as the US will be closed on Thursday in observance of Thanksgiving with little market activity on the following Friday.
Those low liquidity conditions can be like kindling for a fire, and when provided proper spark can lead to really outsized moves.
The sparks in question come from a familiar foe of Covid. As numbers continue to rise to dramatic levels in Germany, the fear is that another lockdown may be around the corner. As you can imagine, many Europeans aren’t happy about that, and that’s already led to some rioting in normally peaceful areas of the continent. This can spell for some pretty massive difficulties when setting monetary policy but the one thing is clear is the divergent paths between European and American economies, and that can put more and more pressure on the pair as the prospect of rate hikes are really only relevant on one side of the trade.
The big level that’s about to come back into play is at 1.1212, which is the 61.8% Fibonacci retracement of the ‘lifetime move’ in the pair. This level set resistance as the pair ranged for about two years between 2015-2017 and it came back into the equation in November of 2018 to help set that year’s low.
As for recent analysis: I had looked at a zone of short-term resistance potential last Wednesday and that area soon came into play, only for sellers to take another swing while driving in another fresh low to start this week.
EUR/USD Monthly Price Chart
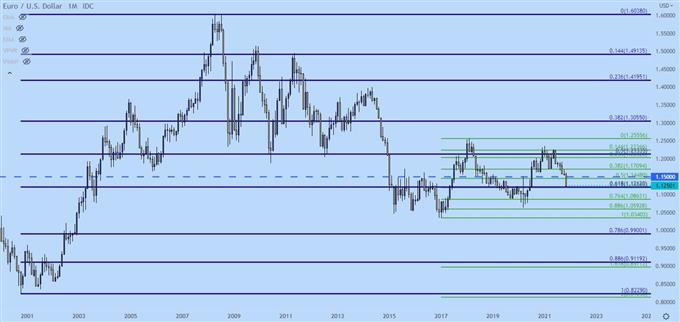
Chart prepared by James Stanley; EURUSD on Tradingview
GBP/USD: Still in Bull Flag
On the other side of the US Dollar, GBP/USD could possibly hold some allure for pullback themes.
The pair remains in a bull flag formation but there’s been little sign of bullish price action thus far. Even last week brought upon a quick resistance test that was followed by another influx of sellers. The price to watch at this point is the 1.3354 swing low, a breach of which opens the door for a run down to 1.3250.
GBP/USD Daily Price Chart
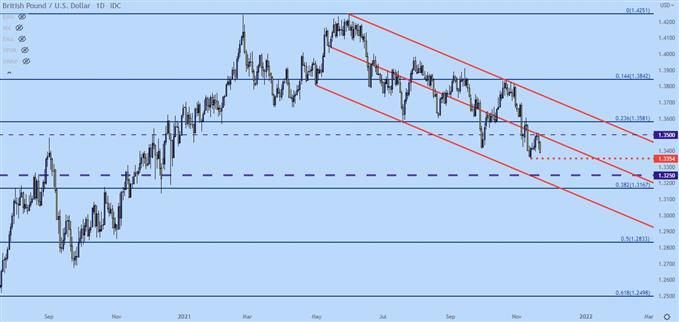
Chart prepared by James Stanley; GBPUSD on Tradingview
USD/CAD Bullish Continuation
Last Wednesday, I highlighted a bullish breakout setup in USD/CAD, highlighting an area of resistance that had come into play earlier in the year and was seemingly back in the equation, running from 1.2621-1.2632.
That breakout has taken hold and the bullish trend has continued, which started with the reversal from the falling wedge formation back in mid-October.
At this point, bullish continuation themes remain in-play and that last spot of resistance, around 1.2662 can be re-purposed as an ‘s1’ zone of support with the prior resistance zone of 1.2621-1.2632 functioning as an ‘s2’ for bullish continuation themes.
USD/CAD Four Hour Price Chart
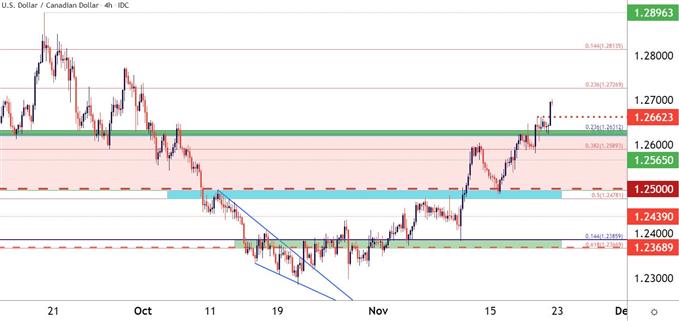
Chart prepared by James Stanley; USDCAD on Tradingview
USD/JPY: Remaining Breakout Potential
Also on the long side of the USD, I had looked into USD/JPY, focusing in on support around the 114.00 handle. Friday of last week saw sellers probe below that support only to be met with buying pressure, and prices are now re-approaching the high that was just underneath the 115.00 psychological levels.
There are likely a lot of stops sitting above the big figure, and at this point, the chart carries bullish breakout potential after a really big showing on Monday, keeping the door open for even fresher four year highs.
USD/JPY Four-Hour Price Chart
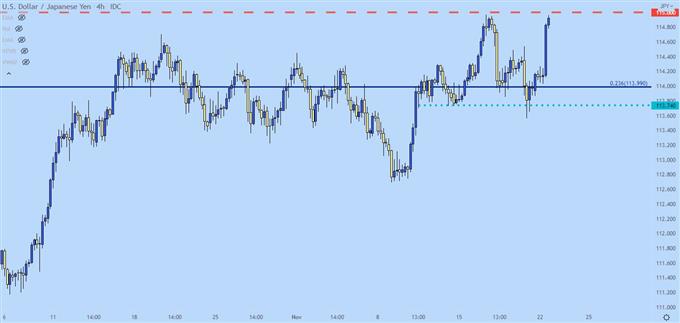
Chart prepared by James Stanley; USDJPY on Tradingview
— Written by James Stanley, Senior Strategist for DailyFX.com
Contact and follow James on Twitter: @JStanleyFX
element inside the
element. This is probably not what you meant to do!Load your application’s JavaScript bundle inside the element instead.
www.dailyfx.com