
Bitcoin News & AnalysisBitcoin falls below prior support turned resistance at around 19,600BTC/USD downtrend remains intact as bears look towards
Bitcoin News & Analysis
- Bitcoin falls below prior support turned resistance at around 19,600
- BTC/USD downtrend remains intact as bears look towards key technical levels from the 2020 – 2021 move
- Price action highlights another zone of confluency that may held both bulls and bears at bay
Bitcoin Technical Analysis
Bitcoin prices have fallen back to another key zone of support that capped the downward move in late June at 18,595.60.
After breaking below the bear flag in mid-August, a break of 20,000 allowed bears to drive prices lower before reaching another key zone of support at around 19,600. Although this level has recently come back into play, it has also been responsible for providing key resistance for the major crypto since 2017.
Recommended by Tammy Da Costa
Get Your Free Introduction To Cryptocurrency Trading
Bitcoin Weekly Chart
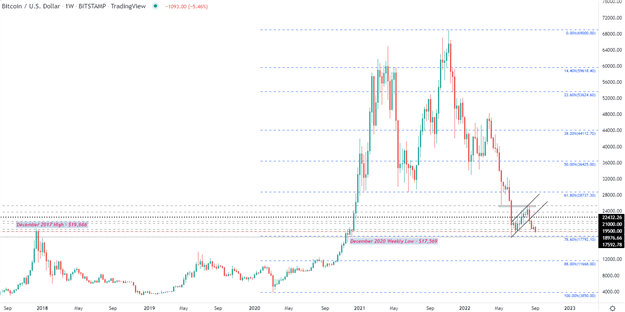
Chart prepared by Tammy Da Costa using TradingView
For those who may recall, BTC/USD originally peaked on 17 December 2017 when BTC/USD reached an all-time high of 19,666. Since then, a break of this zone in December 2020 fueled the uptrend that allowed the major cryptocurrency to rise before reaching another record high of 69,000 in November last year.
A break below prior support turned resistance has enabled sellers to push prices back towards the late June low at 18,595. If prices continue to fall, a move below the 18,000-psych level may allow for a retest of the 78.6% retracement of the 2020 – 2021 move at 17,792 with the next layer of support holding at the December 2020 low of 17,569.
Starts in:
Live now:
Sep 27
( 17:09 GMT )

Recommended by Tammy Da Costa
Trading Price Action
Bitcoin (BTC/USD) Daily Chart
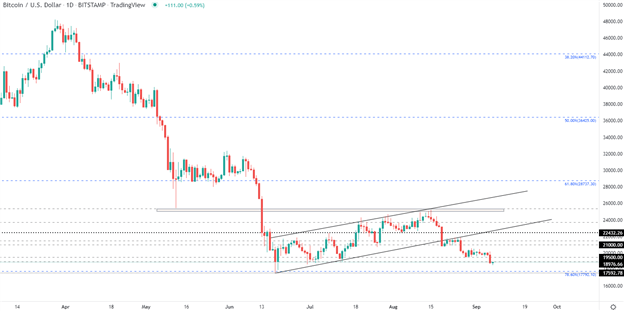
Chart prepared by Tammy Da Costa using TradingView
As short-term price action continues to whipsaw between 18,500 and 19,000, the four-hour chart highlights how these historical levels have formed zones of confluency that continue to hold both bulls and bears at bay. For the upside move, a move above 19,000 and 19,500 could see a retest of 19,666 and a probable retest of the next layer of resistance at 20,418.
Bitcoin Four-Hour Chart

Chart prepared by Tammy Da Costa using TradingView
— Written by Tammy Da Costa, Analyst for DailyFX.com Contact and follow Tammy on Twitter: @Tams707
element inside the
element. This is probably not what you meant to do!Load your application’s JavaScript bundle inside the element instead.
www.dailyfx.com