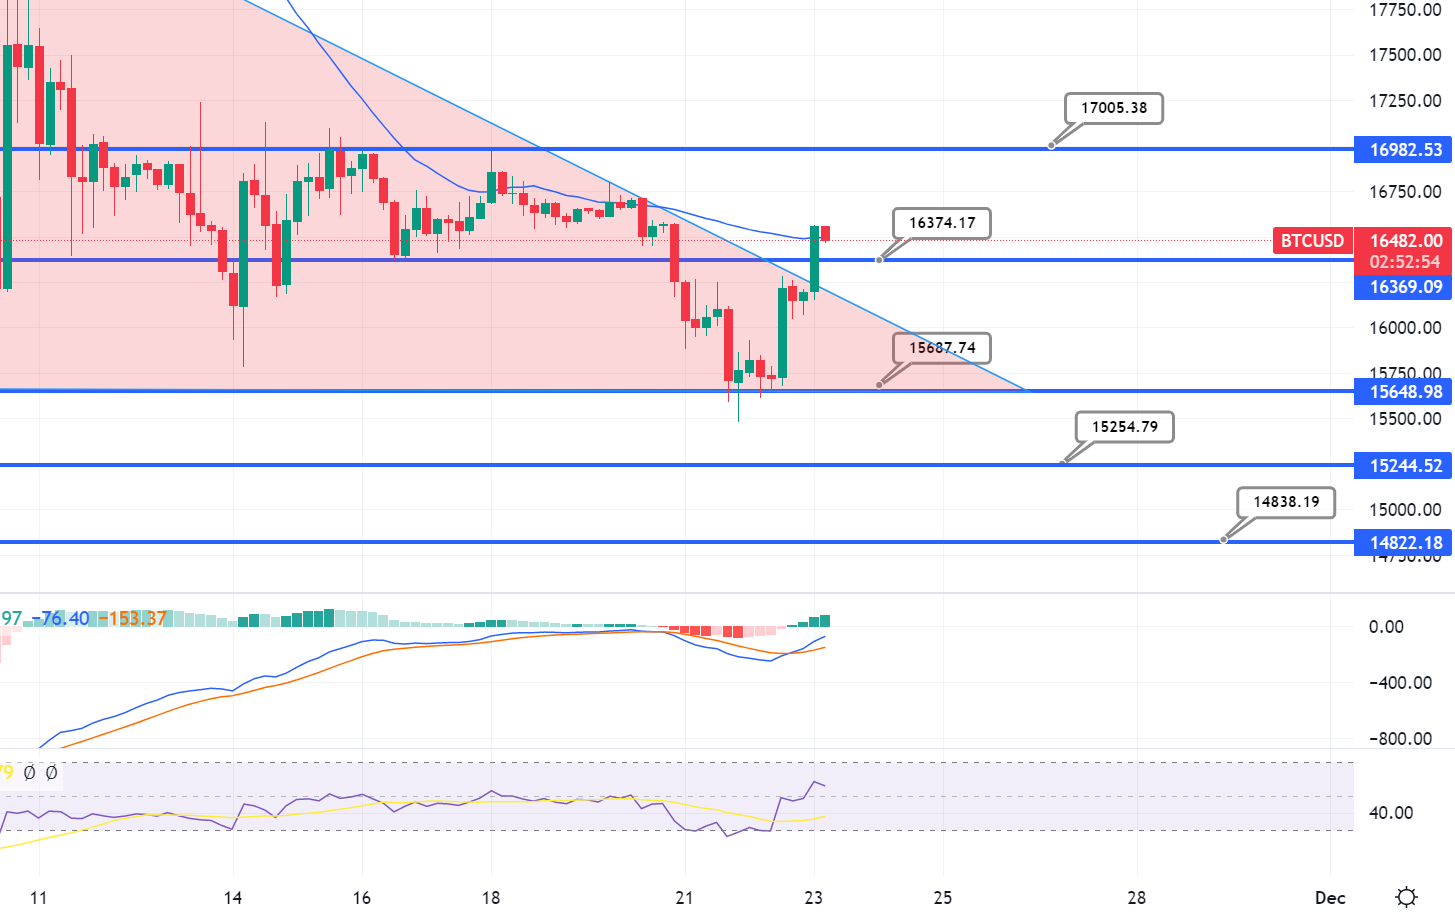
Bitcoin’s price began an upward correction from $15,500. BTC is currently seeing heavy resistance near the $16,300 region and the 100 hourly SMA.
Bitcoin’s price has continued to fall below the $16,000 support level.
BTC fell below the $15,800 support barrier while bulls were active near the $15,500 mark.
A low was created near $15,470, and the price began to rise. The price broke through the $15,800 and $16,000 barrier levels. The bulls managed to shove the price above the 50% Fib retracement level of the crucial slide from the swing high of $16,795 to the low of $15,470.
The price of bitcoin is currently trading under $16,300 and the 100 hourly simple moving average. On the hourly chart of the BTC/USD pair, a critical negative trend line is forming with resistance near $16,200.
On the upswing, an immediate resistance level is near $16,200. The first significant barrier is near $16,300 and the 100 hourly simple moving average. It is near the 61.8% Fib retracement level of the crucial slide from the swing high of $16,795 to the low of $15,470.
To begin a decent rebound wave, the price must pass the trend line resistance and then $16,300. The next big resistance is near $16,500, and the price may accelerate toward the $17,000 zone. If bitcoin fails to rebound over the $16,300 barrier level, it may begin a new drop.
The next significant support zone is near $15,550, below which the price may struggle to stay over $15,500. A decisive break below the $15,500 support level might push the price down to the $14,000 support level.


