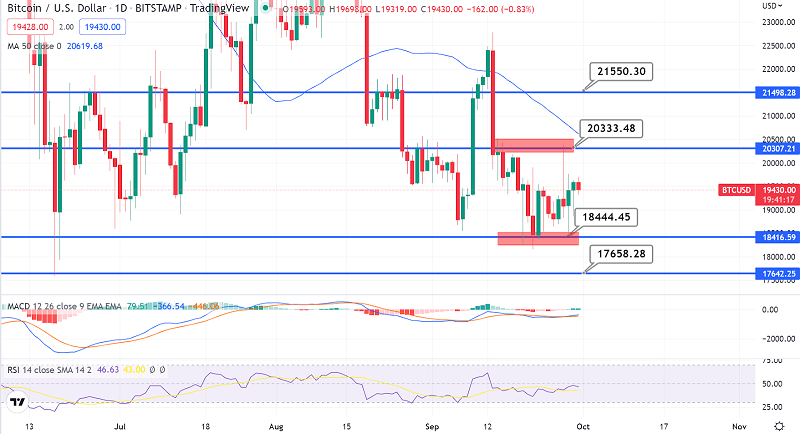
Bitcoin is still trading above the $19,000 mark against the US dollar. If there is a convincing move well above the $19,660 resistance zone, BTC might
Bitcoin is still trading above the $19,000 mark against the US dollar. If there is a convincing move well above the $19,660 resistance zone, BTC might surge. BITCOIN maintained its stability and consolidated above the $19,000 support level.
The price is currently trading above $19,100 and the 100 hourly SMA. On the hourly timeframe of the BTC/USD pair, a key bullish trend line is forming with support near $19,220. The pair might begin a new rally if there is a convincing move above the $19,660 resistance zone.
Bitcoin began a comeback wave from the $18,500 support level. BTC bulls were active over $18,500, pushing the price above the $19,000 resistance level. There was a definite rise over the 50% Fib retracement level of the crucial slide from the swing high of $20,382 to the low of $18,486. Although the price rose above the $19,500 resistance level, bears were aggressive between the $19,650 and $19,660 levels.
BTC/USD
Bitcoin is consolidating above the $19,100 mark and the 100 hourly simple moving average. On the hourly timeframe of the BTC/USD pair, a key bullish trend line is forming with support near $19,220. On the upswing, an immediate resistance level is near $19,500. The next significant resistance level is $19,660. It is near the 61.8% Fib retracement level of the crucial slide from the swing high of $20,382 to the low of $18,486.
A decisive break above the $19,660 resistance level might spark a new uptrend. The price could possibly breach the $20,000 resistance zone in the described scenario. The next significant barrier is in the $20,500 level, beyond which the price may revisit the $21,000 level.
Bitcoin’s Immediate Support Levels
If Bitcoin fails to break over the $19,660 resistance level, it may begin a new drop. On the downside, immediate support is near the $19,350 area and the 100 hourly SMA.
The next significant support is located in the $19,220 area and the bullish trend line. The primary support is close to $19,000. Any further losses could lead to a slide near the $18,500 support level in the coming sessions.
www.fxleaders.com
