Posting this as an ICYMI. Dow Jones news/Market Watch have the piece, highlighting a fat red flag investors may want to heedIt's an index calculated
Posting this as an ICYMI. Dow Jones news/Market Watch have the piece, highlighting
a fat red flag investors may want to heed
It’s an index calculated by Citigroup equity stategists of global sell-side recommendations:
“Our index of global sell-side recommendations is back to peak bullishness levels reached in 2000 and 2007, after which global equities halved”
“Analysts are net buyers of every sector in every region, but then they usually are,”
“They are still bullish on cyclical sectors suggesting few fears of oncoming global recession.”
Here is the link to the Market Watch article, which does caveat with:
Citi’s bear market checklist, which has eased to 6 from a potential 18 flags. Note, this particular flag gave a false sell signal in 2012, when global stocks were flat for the following 12 months.
This
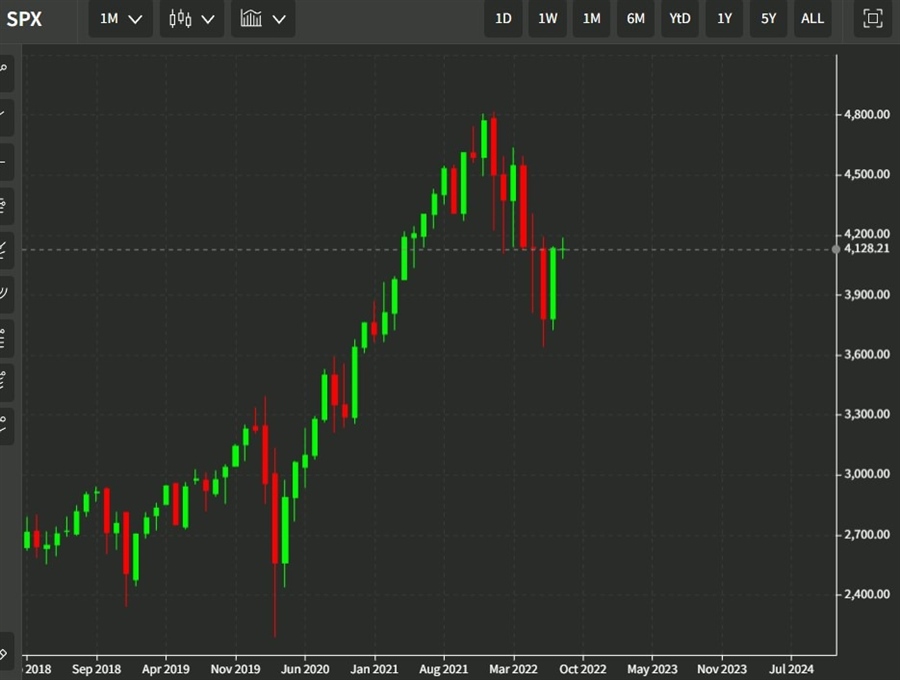
chart is from our charting app, which is free and can
be found at this link
www.forexlive.com
