
S&P 500, VIX, Volume, Dollar, EURUSD and USDCAD Talking Points:The Market Perspective: S&P 500 Bearish Below 4,100; EURUSD Bullish Above 1.00
S&P 500, VIX, Volume, Dollar, EURUSD and USDCAD Talking Points:
- The Market Perspective: S&P 500 Bearish Below 4,100; EURUSD Bullish Above 1.0000
- With the US markets back online after the extended holiday weekend, we have moved into seasonal shift away from the ‘summer doldrums’ and into more active fall trade
- Risk aversion persisted through this past session, but recession fears may be relenting to monetary policy speculation at an inopportune time with BOC and ECB ahead
Trade Smarter – Sign up for the DailyFX Newsletter
Receive timely and compelling market commentary from the DailyFX team
Subscribe to Newsletter
Have We Made the Definitive Transition in Liquidity and Volatility to Match Seasonal Expectations?
Market conditions were generally restored after the long, holiday weekend in the US; but it is still far too early to suggest that we have made a hard pivot from the seasonal illiquidity of the ‘summer doldrums’ back into the open waters of fall trade. Fundamentally, there are some serious matters that continue to dog the capital markets including the accelerated tempo of interest rate hikes by the major central banks, but my priority remains the level of participation. With market depth comes the ability to translate volatility into potential traction for trends. Conviction is no small feat to come by, but the expectations born out by historical averages leave increasingly limited coverage for market participants to avoid the very significant headwinds that continue to kick up. From my preferred, imperfect measure of ‘risk’ – the S&P 500 – the first active session of the week and season was a modest extension of the past two-week slide. Though the index posted a new low back to July 18th, there wasn’t much in the way of progress (we wouldn’t even slip the 61.8 percent Fib retracement of the Jun 16th to August 16th bull run. If markets are indeed transitioning following seasonal norms, I will remain on high alert for swings that turn into full trends.
Chart of S&P 500 with 50-Week SMAs Volume and 3-Week ROC (Weekly)
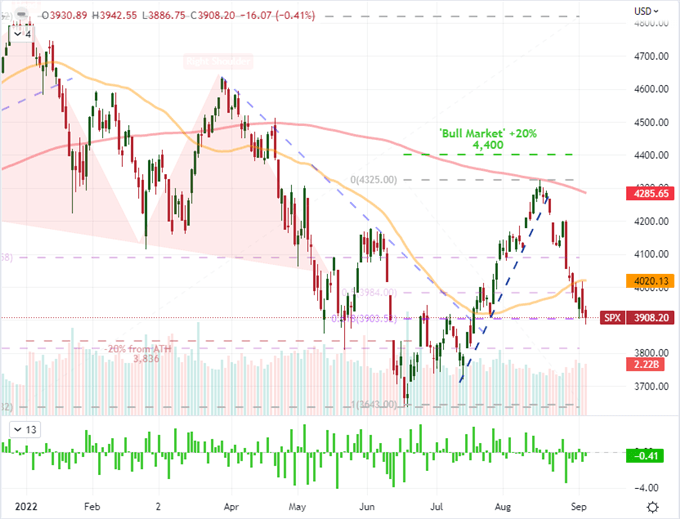
Chart Created on Tradingview Platform
While my principal measure for scope of market capacity is participation (volume, open interest, etc), an interesting measure to consider is the response to fundamental developments. When there is an update from an important event risk that sparks a significant response from the financial system, it can say something about the market with which we are dealing. This past session, the ISM service sector activity report – which represents roughly three quarters of US output and employment – beat expectations. The headline figure was 56.9 vs 55.1 expected while the jobs component jumped back into ‘growth’ territory at 50.2. Perhaps the market simply intended to undercut favorable data or the S&P Global’s final readings on its own service sector report (43.7 vs 44.1 initially reported) case enough doubt to undermine confidence. Either way, it is worth keeping close tabs on the market’s response to top event risk going forward.
Chart of S&P 500, US ISM Manufacturing and Service Sector Activity with Official Recessions (Monthly)
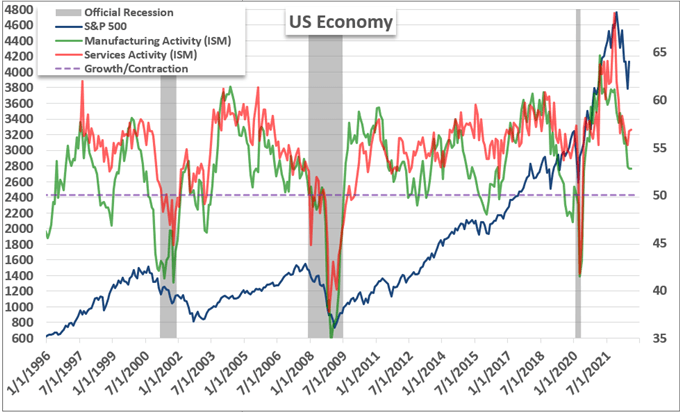
Chart Created by John Kicklighter with Data from FRED St Louis Federal Reserve Database
For expectations, the seasonal norms represent a strong draw for those that have been involved with the markets for more than a few years. There are norms that arise around the performance of the markets that statistically follow historical averages; however, there is nothing that say that the markets have to follow the pre-destined course. When it comes to the history of the S&P 500, there is a material statistical finding that September represents the only calendar month in which the benchmark has averaged a loss of the calendar year. Of course, the range of examples varies, but the average is not one to overlook. That said, variation depends on context and intensity; so my interest is far more substantially honed in on participation and volume. In both accounts, we are in a month of upswing which doesn’t really abide the unusual circumstances of each year individually.
Chart of Calendar Month Average S&P 500 Change, Volume and Volatility from VIX
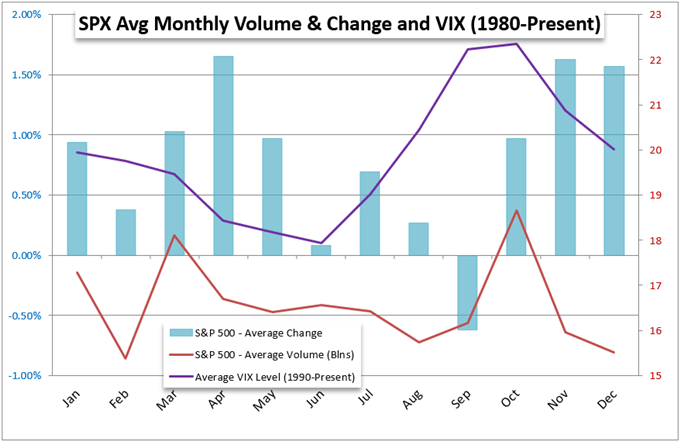
Chart Created by John Kicklighter
What to Watch on the Docket Ahead
To determine what has the greatest market-moving potential, we need to both assess the docket ahead and determine what has garnered the most traction from benchmark market measures over recent history. It seems, for example, that the fears of recession have ebbed significantly as of late. That is not to say that such an affliction has been avoided. Far from it as many of the pieces are in place for a sharp contraction. That said, with measures like the Atlanta Fed GDP forecast bouncing while the ISM avoids deeper inversion often associated with official recessions, it is not a surprise to find speculative interpretation at work. I personally still believe recession risks are something of material importance, but its abstract nature will not lend itself well to definitive market movements.
Global Calendar of Top Macro Economic Event Risk for Next Week
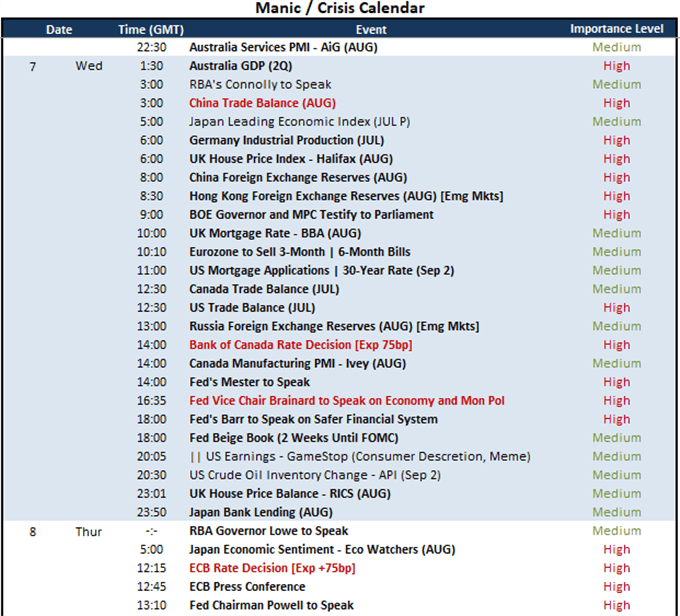
Calendar Created by John Kicklighter
Meanwhile, monetary policy considerations are a top FX motivation that is spilling over readily into the capital markets. This past session, the Reserve Bank of Australia (RBA) announced another 50bp rate hike – a move of historical significance but ultimately in line with expectations. With a number of the Australian authority’s counterparts moving faster – and sometimes without the same heads up – it is perhaps not a surprise to seek the Aussie Dollar struggle despite a tightening measure. Expectations play a serious role in market impact of major event risk – and we will definitely put that dynamic to work with the upcoming Bank of Canada rate decision due today and the European Central Bank meeting on Thursday. Both are seen hiking their respective benchmark rate 75bps at this meeting, but the former is working from a 100bps hike at its last meeting and the discount of a hawkish central bank. The ECB joining such a cadence would break through much skepticism.
Spectrum of Monetary Policy Stance by Major Central Banks with Year-End Rate Forecast via Swaps
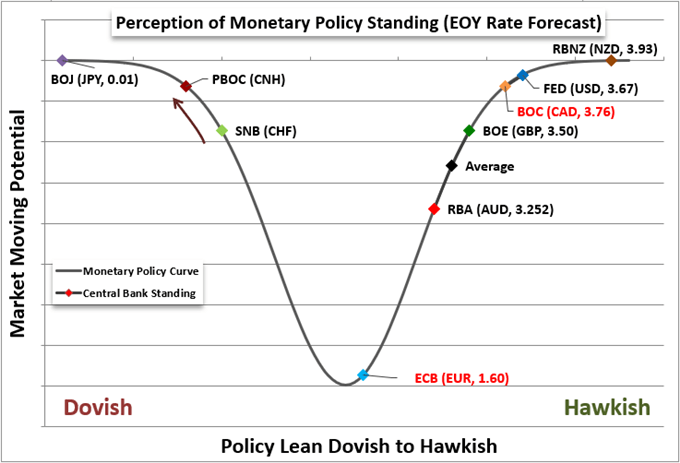
Chart Created by John Kicklighter
The Central Bank Pairs to Watch Moving Forward
As we move forward into the week, the most provocative market measures to watch are those better suited to isolate the macro themes. For the US Dollar, the cross winds of relative growth expectations, safe haven status and interest rate advantage are all vying for sway. However, we can place markets to measure alterative influences or to serious amplify the aforementioned matters. For example, EURUSD can focus the interest in whether the ECB’s effort to catchup to the inflation fight means the Euro should regain lost ground. Speaking of these major central bank players, the ECB rate decision on Thursday will draw a lot of attention – as it should from the world’s sector largest central bank. In the meantime, we can trade the systemic for regional with key event risk on the docket. In particular in this next 24 hours, I’m interested in the market response to the Bank of Canada (BOC) rate decision Wednesday where the group is seen hiking 75bps after a sharp 100bp surprise hike. Will this prompt similar market response?
Chart of USDCAD with 200-Day SMA and Disparity Index (Daily)
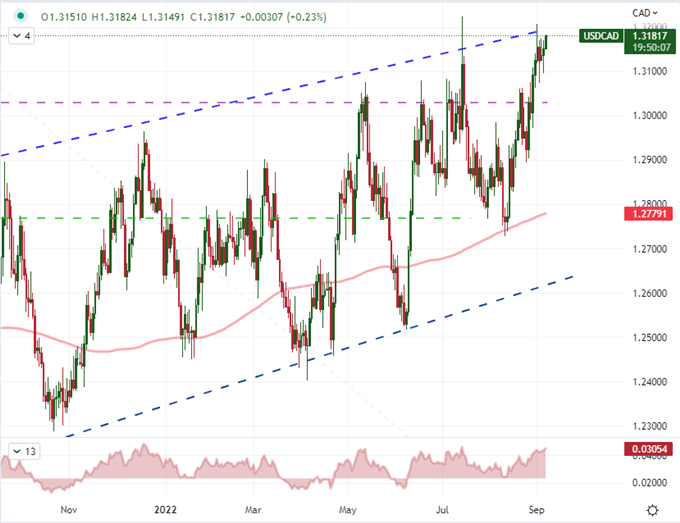
Chart Created on Tradingview Platform

Discover what kind of forex trader you are
element inside the
element. This is probably not what you meant to do!Load your application’s JavaScript bundle inside the element instead.
www.dailyfx.com