
S&P 500, VIX, Dollar, EURUSD and USDCNH Talking Points:The Market Perspective: USDJPY Bearish Below 146; EURUSD Bullish Above 1.0000; Gold Bearis
S&P 500, VIX, Dollar, EURUSD and USDCNH Talking Points:
- The Market Perspective: USDJPY Bearish Below 146; EURUSD Bullish Above 1.0000; Gold Bearish Below 1,680
- A disparity between realized and expected volatility persists with seasonal expectations confronting very real systemic problems on the horizon – creating a very uneven backdrop
- Scheduled event risk over the next 48 hours seriously lacks for one-punch market impact until we reach Thursday’s CPI, but that should lull us into complacency
Recommended by John Kicklighter
Building Confidence in Trading
A Very Quiet Start to the Week for S&P 500 and Risk…In Line with Historical Norms?
There has been an overt divergence in the level of actualized volatility in the financial system versus the anticipated activity drawn from popular indicators like the VIX. I don’t believe that fight has been decided, but we find ourselves in a position whereby the market would be naturally throttled in the lead up to the next major event risk. The October US consumer price index (CPI) has seen celebrity amplified after last week’s FOMC rate decision pushed out the end date of its tightening regime and subsequently raise the perceived terminal rate next week. Naturally, if we are waiting to see how this event lands, it stands to reason that there will be limited interest to ramp up exposure to uncertain speculative tides in the interim. It is under that sense of ‘anticipation’ that I can understand the restriction in activity to start this trading week. The S&P 500 managed to widen out one of its most restrictive trading range of 2022 in the final hours of trade Monday, but the low volume and the hold below 3810/15 – the 38.2 percent Fib of the August 16th to October 13th bear leg and the same percentage of the post-pandemic low to December 2021 record high – suggests tepid conviction is amplifying technical influence.
Chart of S&P 500 with 100 and 200-Day SMAs, Volume and 1-Day Historical Range (Daily)
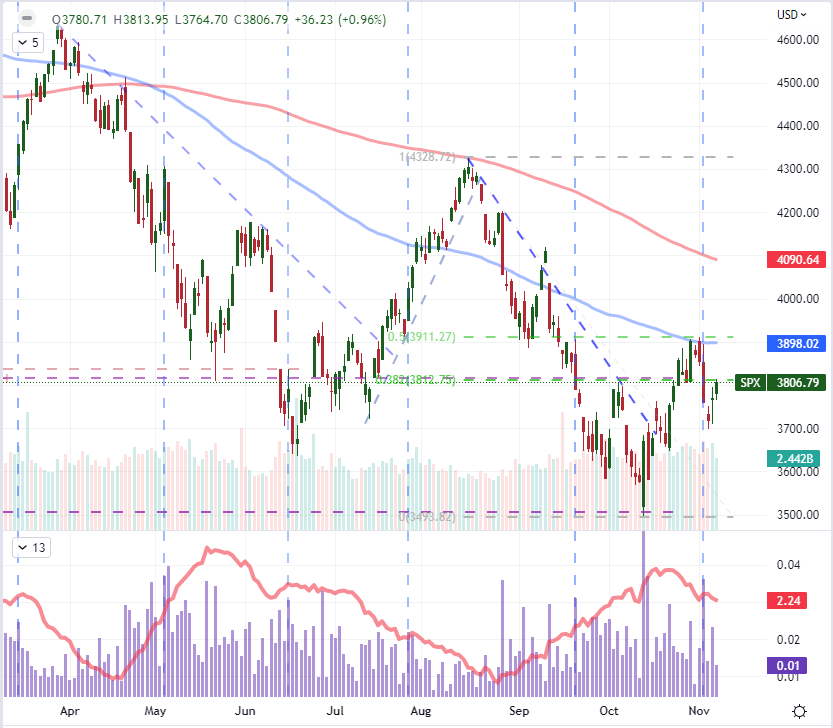
Chart Created on Tradingview Platform
For some, the downshift in market activity for the S&P 500 and other risk assets seems to fall directly in-line with typical measures of implied (or ‘expected’) volatility. The traditional VIX volatility index has extended its slow but progressive four-week side from the most recent 2022 peak just above 34 to Monday’s close at 24.3. This level is still notably higher than historical averages from periods like 2019 or 2017 when markets were extremely reserved, but the fundamental backdrop stands in direct opposition to this complacency. What’s more, the backdrop for entertaining such obliviousness among speculators is no longer present. The pressure from extreme exchange rates, high interest rates on financial health and reasonable concern around an impending recession deserves greater deference from market watchers. As such, seeing the lows in VIX along with the extreme lows in the ‘volatility of volatility’ index (VVIX) and tail risk barometer (SKEW) increases my concern that the markets are ill-prepared for surprises.
Chart of the VIX, VVIX and SKEW Volatility Indices (Daily)
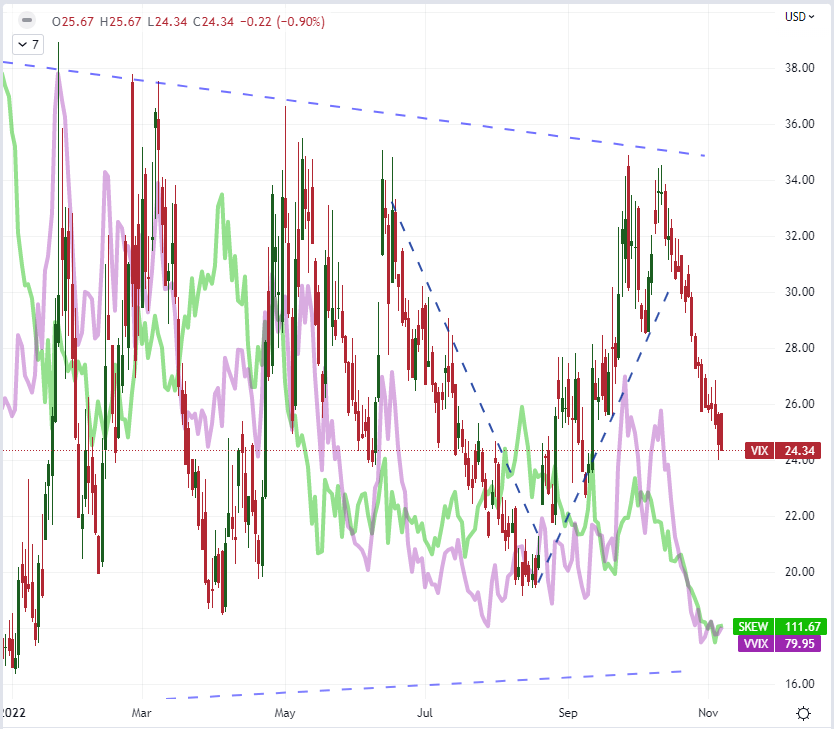
Chart Created on Tradingview Platform
Seasonality and the Dollar
For those traders that have a history on the markets that spans less than a decade, and particularly among those that pursue a long-only positioning, seasonal expectations can represent a powerful anesthetic of reassurance that complacency is setting back in. Historically, the 45th week of the year registers an extended retreat in the historical VIX levels while the underlying US index has averaged meaningful gains through the same period. On a bigger picture reading, the month of November has earned the title of second-best month performance from the S&P 500 stretching back to 1980. That said, I’m not particularly confident in the directional figure as it very much depends on circumstances from year to year; but the drop in volume and volatility we typically see at this time of year may be more consistent. It is possible that we are following the pull of seasonal norms, but the cost of volatility should that peace be broken among such systemic threats seems far too great to simply conform to ‘go with the flow’.
Chart of Average S&P Monthly Performance with Volume and Volatility
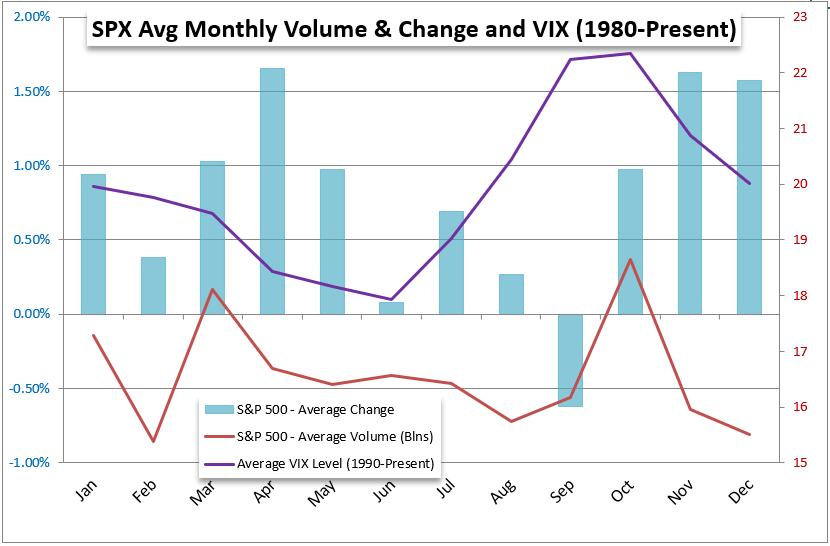
Chart Created by John Kicklighter
The same downshift in market activity may have helped the Dollar brake up a full meltdown to start this new week. If you missed it, this past Friday, the Dollar suffered a broad and intense decline. The DXY Dollar Index registered its worst one-day loss to close in seven years to close out last week. That was an extreme move given that the economic listings for that season seemed to project support for the US currency with stronger November payrolls and considering the longer-term trend has seen the currency extend its longest medium-term run (measured by days above the 100-day SMA) on a five-decade record. This week opened to a broad gap up in the Dollar’s favor, but most crosses would eat up that effort to revive the currency. For EURUSD, the bearish gap opening gap was the biggest in 8 months; but it would ultimately make its way back above parity on the close. That said, this seems far from a resolved technical – much less fundamental – move.
Recommended by John Kicklighter
How to Trade EUR/USD
Chart of EURUSD with 100-Day SMA and Daily Gap (Daily)
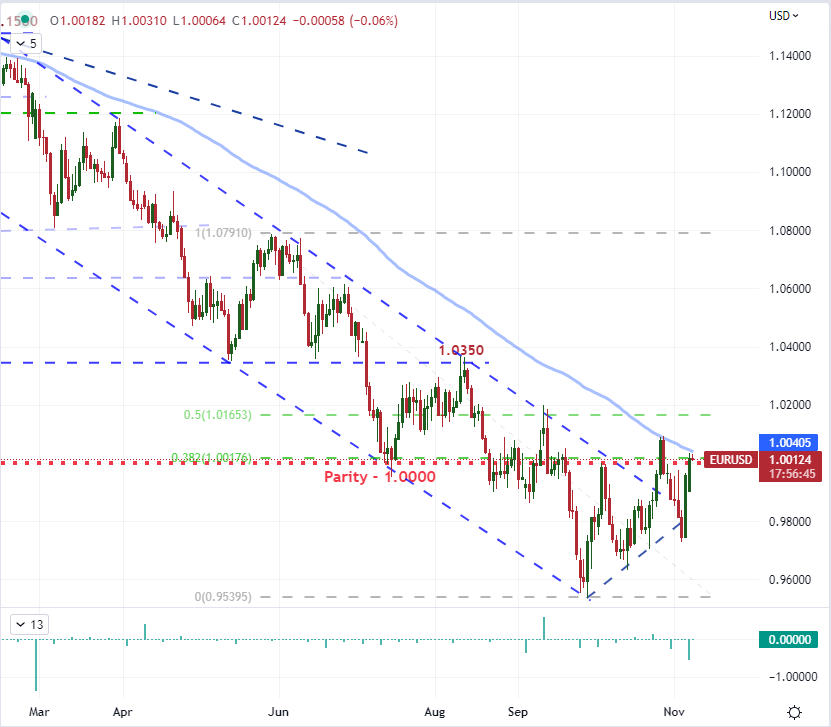
Chart Created on Tradingview Platform
Where the Fundamentals Stick: USDCNH and the Economic Calendar
For most of the Dollar-based majors, the currency’s attempted recovery to star this week fell apart and the eventually saw new short-term lows established. The exception to the rule was USDCNH. The gap higher Monday morning was the largest registered by this exchange rate since the Chinese authorities allowed it to more closely reflect a market-derived float. Yet, where the Greenback quickly gave back ground against other pairs, that traction didn’t take here. The interest rate differential is less exceptional here to me than is the relative safety appeal of the dominant transparent player versus the opaque financial powerhouse of China. What’s more, tentative interest in the Eastern market has fallen apart as disputes of a quick economic reopening by China’s government have arisen and were further bolstered by the significantly weaker-than-expected October trade balance release. I’ll be watching closely to see whether or not this exchange rate (the fourth most liquid according to the BIS’s recently released triennial report) holds above 7.0000.
Chart of USDCNH with 50-Day SMA and Daily Gaps (Daily)
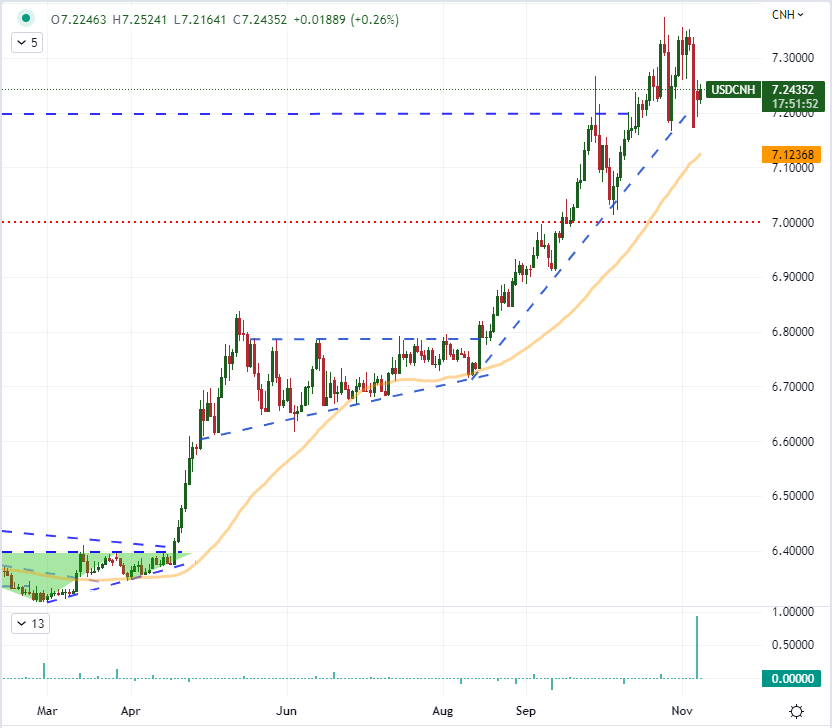
Chart Created by John Kicklighter
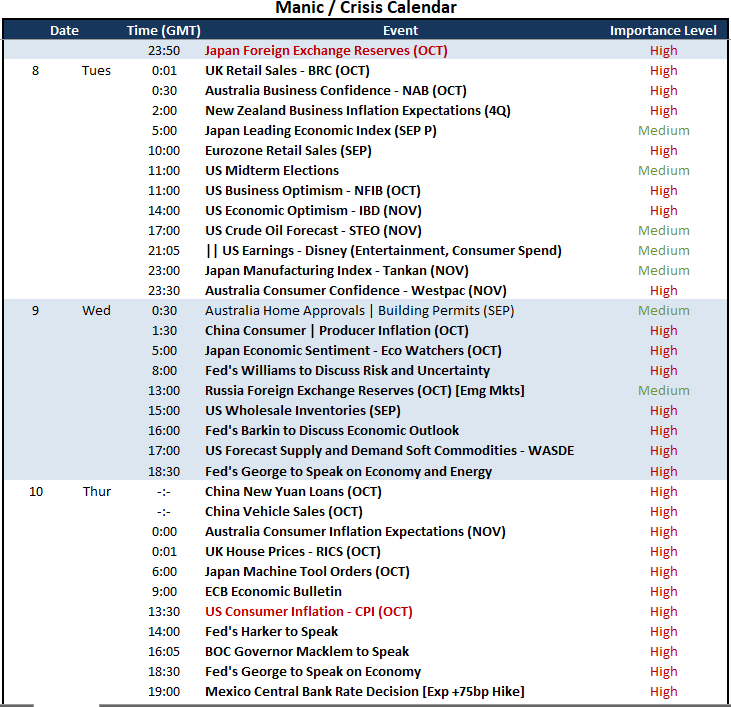
For scheduled event risk ahead, the immediate future has more than a few events that I consider interesting and important from a macro perspective. Yet, whether that interest will turn into tangible market movement is another matter entirely. One of the more effective mediums through which event risk tends to translate into volatility in my experience is how closely it hews to the critical themes the market is following. US sentiment surveys (NFIB business and IBD economic) is noteworthy with the context of recession fears, but far from definitive. Japan’s FX reserves is interesting from an intervention assessment perspective while New Zealand and Australia are weighing in on businesses’ perspectives. Perhaps the most prominent event today is the US midterm elections, but that doesn’t historically exact a strong short-term impact on the market as any subsequent political changes take time to be fleshed an enacted – if they are enacted at all. That said, anticipation can be a remarkably consistent force.
Critical Macro Event Risk on Global Economic Calendar for Next Week
Calendar Created by John Kicklighter
Trade Smarter – Sign up for the DailyFX Newsletter
Receive timely and compelling market commentary from the DailyFX team
Subscribe to Newsletter
element inside the
element. This is probably not what you meant to do!Load your application’s JavaScript bundle inside the element instead.
www.dailyfx.com