Article by IG Senior Market Analyst Axel RudolphDow Jones, Nasdaq 100, Nikkei 225 - Analysis and ChartsDow hits fresh post-January 2022 highThe i
Article by IG Senior Market Analyst Axel Rudolph
Dow Jones, Nasdaq 100, Nikkei 225 – Analysis and Charts
Dow hits fresh post-January 2022 high
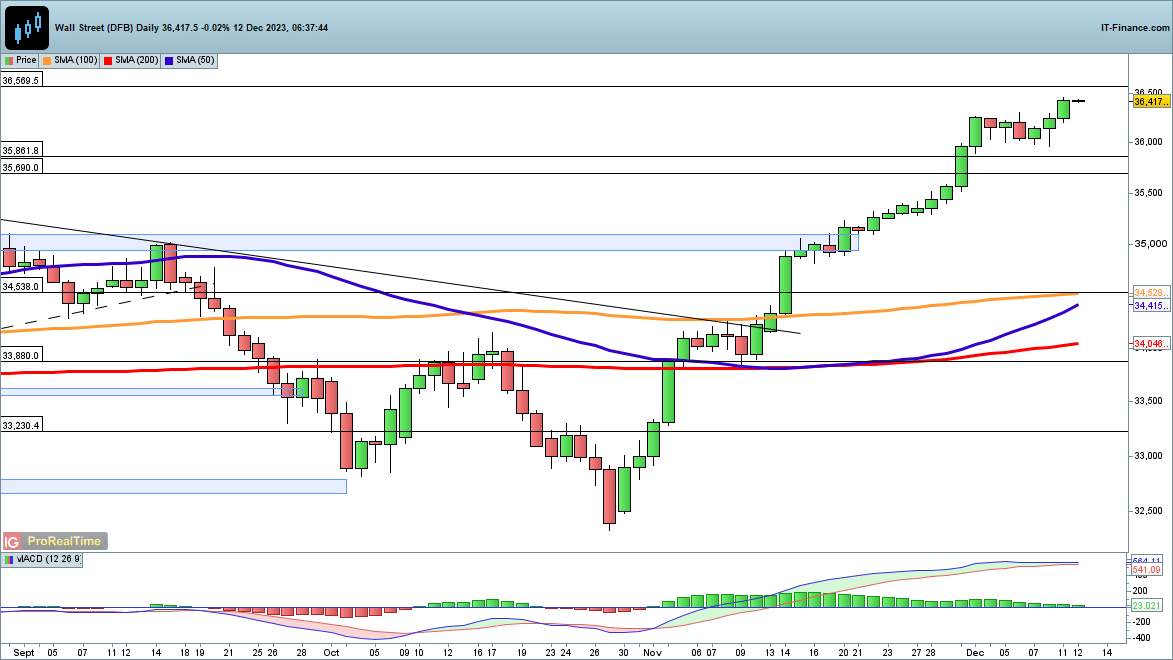
The index continues to demonstrate strong momentum, pushing to its highest level since early 2022, even as the latest US CPI print and Fed meeting loom large in the week’s calendar. The next step would be a test of 36,570, and then on to the record high at 36,954. So far downside momentum has been lacking, though a short-term pullback towards the summer highs at 35,690 would leave the overall move higher intact.
Dow Jones Daily Chart

New to Trading? – You Can Download our Three Beginner’s Trading Guides below
Recommended by IG
Recommended by IG
Complete Beginner’s Trading Guides
Nasdaq 100 pushes through recent resistance
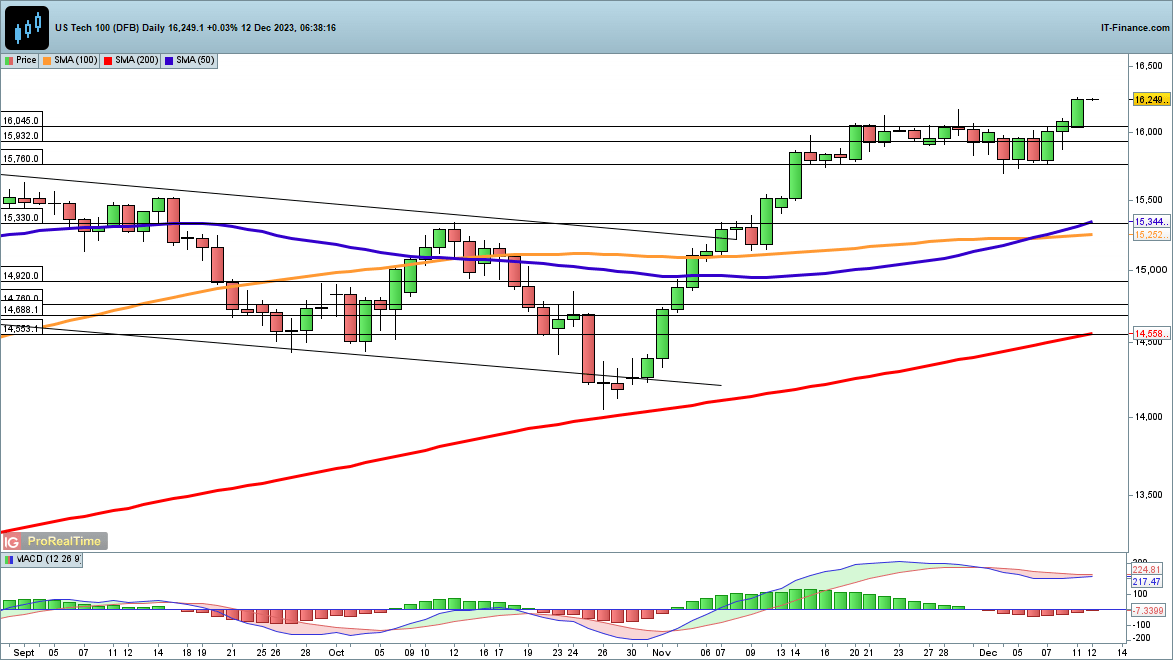
Monday witnessed the index breaking out of the consolidation that dominated for most of November.The price now sits at its highest level since early 2022, and now the 16,630 and 16,769 highs come into view.
Recent weakness has been halted around 15,760, so a move below this would open the way to the August highs at 15,570. After such a strong move a pullback would not be surprising, but for the moment the buyers remain in control.
Nasdaq 100 Daily Chart

A Large Part of Trading is Confidence – Confidence That You are Doing the Right Thing
Recommended by IG
Building Confidence in Trading
Nikkei 225 struggles to maintain recovery
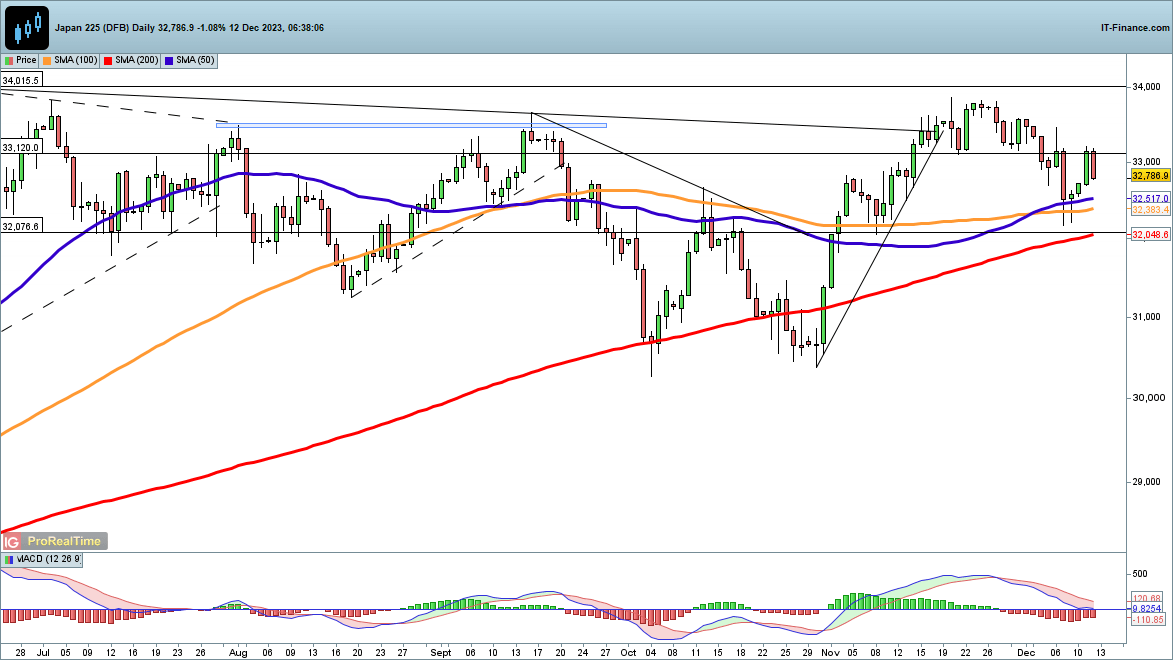
A strong recovery took place here from last week’s lows, as the yen weakened again on dovish commentary from the Bank of Japan, but the index stumbled on Tuesday, giving back gains. A higher low appears to have been established, and now the November highs at 33,800 come into view, followed up by the May highs at 34,000 if the index can recoup its losses.
If sellers can drive the price back below 32,400 then a more bearish view would emerge, and could see a challenge of last week’s lows around 32,200, and then down to the 200-day SMA.
Nikkei 225 Daily Price

element inside the
element. This is probably not what you meant to do!Load your application’s JavaScript bundle inside the element instead.
www.dailyfx.com

COMMENTS