
Dow Jones, Nasdaq, Treasury Yields, Hang Seng, China Lockdowns – Asia Pacific Indices BriefingDow Jones, S&P 500 and Nasdaq 100 fall as Treasury
Dow Jones, Nasdaq, Treasury Yields, Hang Seng, China Lockdowns – Asia Pacific Indices Briefing
- Dow Jones, S&P 500 and Nasdaq 100 fall as Treasury yields keep rising
- Nasdaq/Dow ratio sits near one-month low amid more hawkish Fed
- Chinese lockdown woes weighing on energy stocks and the Hang Seng
Monday’s Wall Street Trading Session Recap
Market sentiment was reeling on Wall Street at the end of Monday’s session. Dow Jones, S&P 500 and Nasdaq 100 futures declined 1.14%, 1.66% and 2.28% respectively. This is as the VIX volatility index, also known as the market’s preferred ‘fear gauge’, soared 15% to close at its highest in almost one month. Risk aversion continued in the aftermath of an increasingly hawkish Federal Reserve.
There were no sectors within the S&P 500 that closed in the green. The 3 worst-performing ones were energy (-3.11%), information technology (-2.60%) and health care (-1.97%). Losses in energy stocks followed weakness in WTI crude oil prices, where the futures contract fell 2.65%. Concerns over China’s worst Covid-induced lockdown on record is dampening demand from a key consumer of oil.
The 10-year Treasury yield gained 2.9% as the Nasdaq/Dow ratio sank to the lowest in almost one month. Chicago Fed President Charles Evans spoke today, noting that the central bank ‘has to be on top of prices and reposition ourselves’. At this rate, a 50-basis point hike seems very likely at the next meeting in May, with quantitative tightening just around the corner as well.
Dow Jones Technical Analysis
On the four-hour chart, Dow Jones futures appear to be carving out a bearish Head and Shoulders chart formation. After forming the right shoulder, prices are testing the neckline around 34263. Confirming a breakout under the latter may open the door to reversing the near-term uptrend seen during the second half of March. Otherwise, pushing above 34820 opens the door to revisiting 35281.
Dow Jones 4-Hour Chart
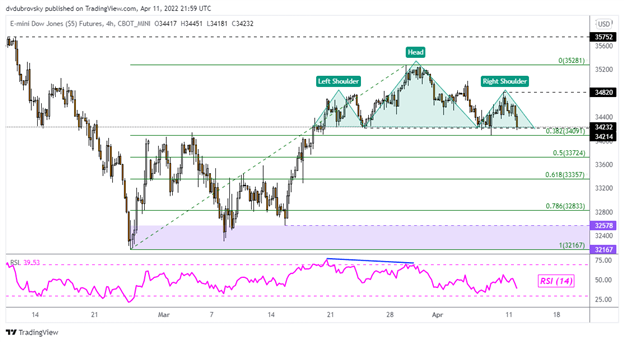
Chart Created in TradingView
Tuesday’s Asia Pacific Trading Session
With that in mind, the rather pessimistic day on Wall Street risks being a precursor to follow-through during Tuesday’s Asia-Pacific session. The economic docket is also fairly light, placing the focus on sentiment. Hong Kong’s Hang Seng Index remains an interesting one to watch given lockdowns in China. According to Bloomberg, China approved the first batch of new video game licenses since July overnight.
That has brought hopes of a turnaround in the government’s views on crackdowns that have been weighing on local indices since February 2021. Unfortunately, this is coming at a time when China’s economy is slowing and global monetary tightening is permeating throughout financial markets. The latter could still weigh on the Hang Seng, especially the tech index (HST).
Hang Seng Technical Analysis
Hang Seng Index futures appear to have broken under a Rising Wedge chart formation. This could hint at extending losses back towards the March low at 18134. Immediate support is the 23.6% Fibonacci extension at 20992 before the 38.2% level comes into focus at 19954. Overturning the Rising Wedge may see prices retest the current April high at 22670.
Hang Seng Index Futures 4-Hour Chart
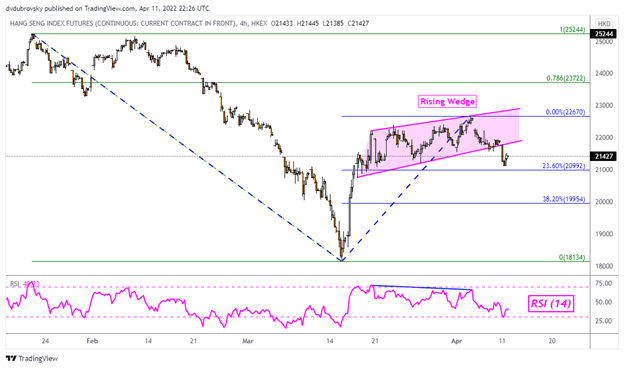
Chart Created in TradingView
— Written by Daniel Dubrovsky, Strategist for DailyFX.com
To contact Daniel, use the comments section below or @ddubrovskyFX on Twitter
element inside the
element. This is probably not what you meant to do!Load your application’s JavaScript bundle inside the element instead.
www.dailyfx.com