Article by IG Chief Market Analyst Chris BeauchampDow Jones, Nasdaq 100, CAC 40 Analysis and ChartsDow gives back recent gainsThe index has fallen t
Article by IG Chief Market Analyst Chris Beauchamp
Dow Jones, Nasdaq 100, CAC 40 Analysis and Charts
Dow gives back recent gains
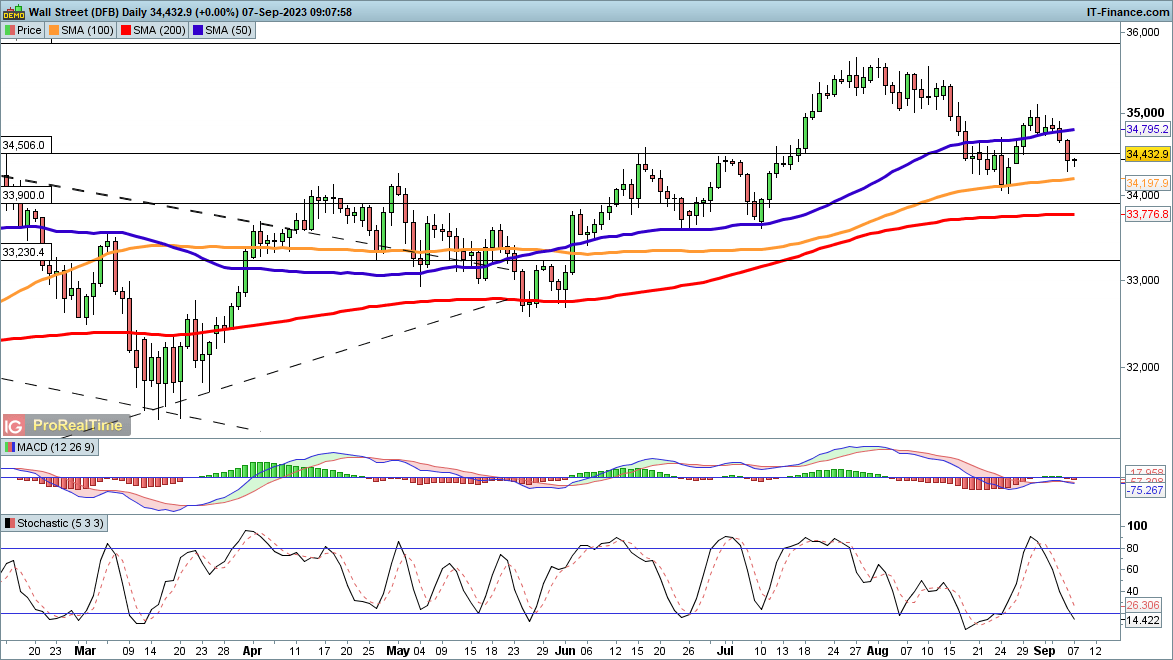
The index has fallen this week, dropping back below the 50-day SMA and heading towards the 100-day SMA.It remains above the August lows, but bulls will need a close back above 34,750 to suggest that a new leg higher has begun, which might then see the index target 35,000, followed up by the late July peak at 35,640.
34,000 marked the low of August, so a close below this level would add to the bearish short-term view and bring the 200-day SMA into play, followed up by the June and early July low around 33,630.
Dow Jones Daily Chart

Recommended by IG
Traits of Successful Traders
Nasdaq 100 comes under pressure
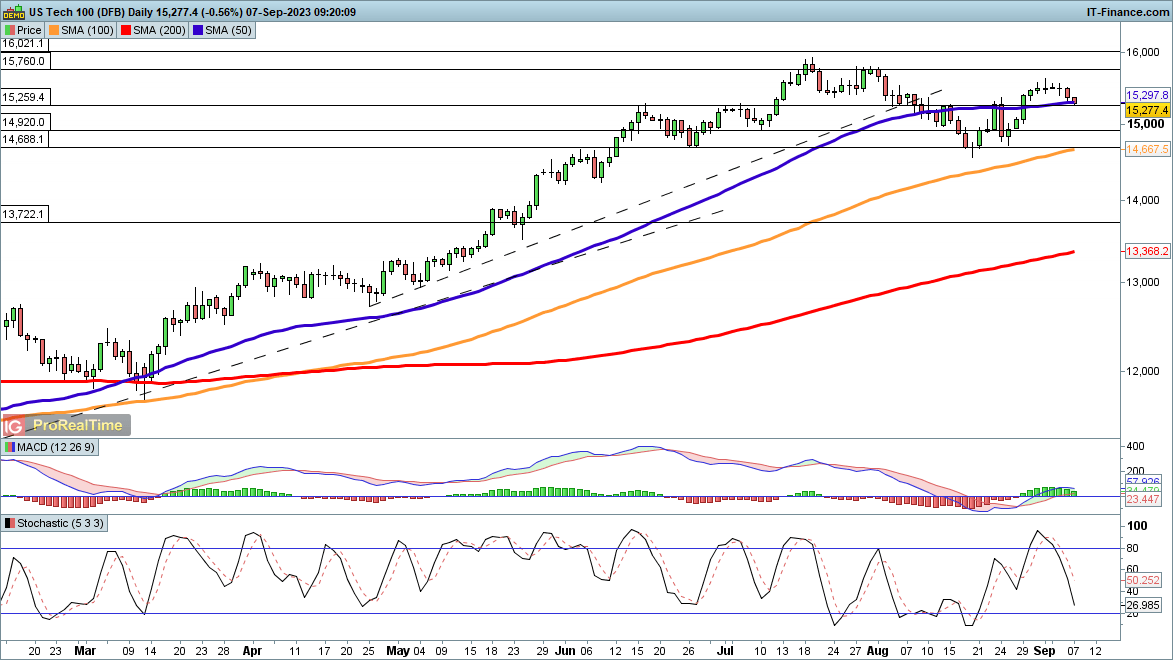
The Nasdaq 100 saw some weakness on Wednesday, and this has continued into Thursday.In the event that these losses extend into a more sustained pullback, the price may retest the August low around 14,688, which would also see it test the 100-day SMA.
Buyers will want to see a move back above 15,400, with a close back above 15,500 signalling fresh bullish momentum, with an initial target of the July highs around 15,900.
Nasdaq 100 Daily Chart

Trade Smarter – Sign up for the DailyFX Newsletter
Receive timely and compelling market commentary from the DailyFX team
Subscribe to Newsletter
CAC 40 back at 200-day moving average
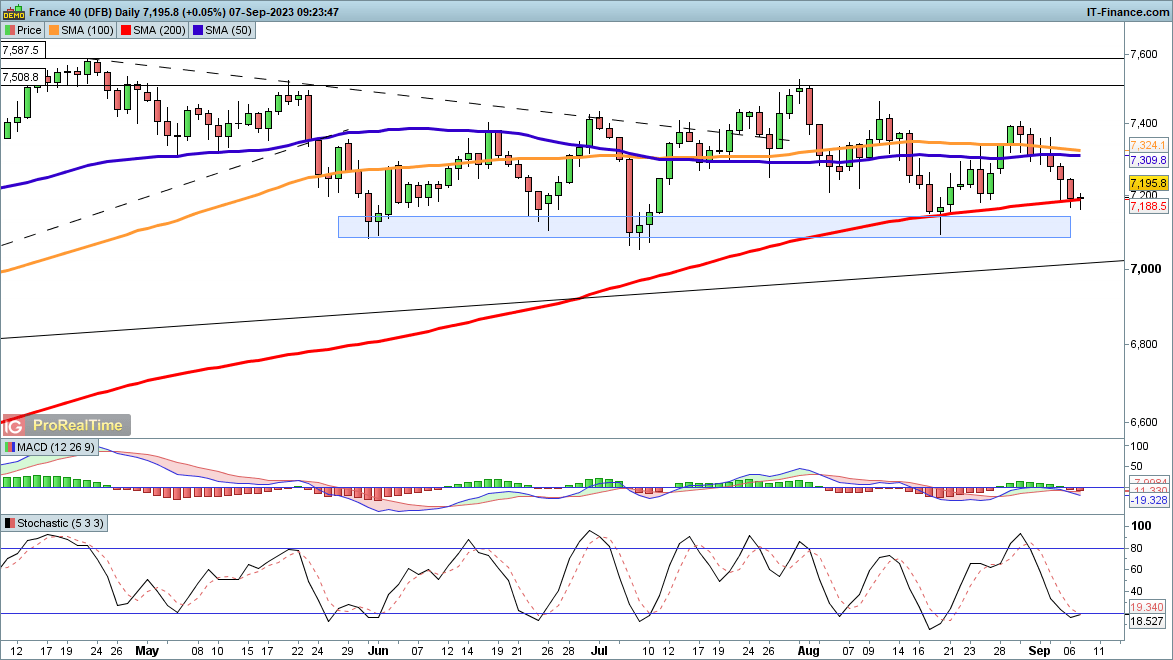
European indices have given back ground over the past week, with the CAC 40 surrendering most of the gains made in the second half of August. The price finds itself testing the 200-day SMA once more, as it did a month ago. If it can repeat the August feat and stage a recovery, then the 7400 level becomes an initial target.
Continued losses bring the price into the area around 7100, which has acted as support since late May.
CAC 40 Daily Chart

Download the Latest IG Client Sentiment Report on the CAC 40
| Change in | Longs | Shorts | OI |
| Daily | 7% | -7% | 0% |
| Weekly | 64% | -28% | 1% |
element inside the
element. This is probably not what you meant to do!Load your application’s JavaScript bundle inside the element instead.
www.dailyfx.com

COMMENTS