Article by IG Chief Market Analyst Chris BeauchampDow Jones, Nasdaq 100, CAC 40 - Analysis and ChartsDow surges through 37,000The index shot to a
Article by IG Chief Market Analyst Chris Beauchamp
Dow Jones, Nasdaq 100, CAC 40 – Analysis and Charts
Dow surges through 37,000
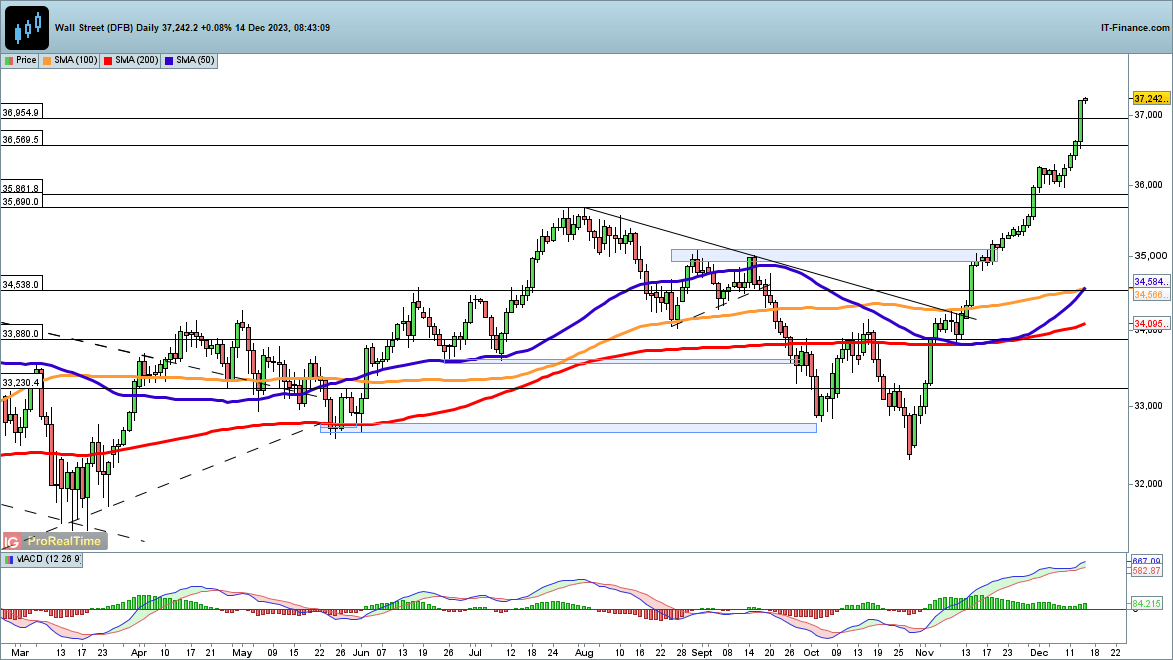
The index shot to a record high last night, closing above 37,000 for the first time in its history. The dovish tone of the FOMC press conference provided fuel for the rally, capping a remarkable period for the index since late October.
Momentum is a powerful force in markets, as we have seen since late October, and so while the price looks overextended in the short term, we could see further gains as positive seasonality kicks in. A pullback might begin with a reversal below the previous highs at 36,954, and could then head back towards the summer highs around 35,690, but at present bearish momentum has yet to show its hand.
Dow Jones Daily Chart

Download our Complimentary Top Three Market Conditions Guides
Recommended by Nick Cawley
Recommended by Nick Cawley
Master The Three Market Conditions
Nasdaq 100 targeting previous peak
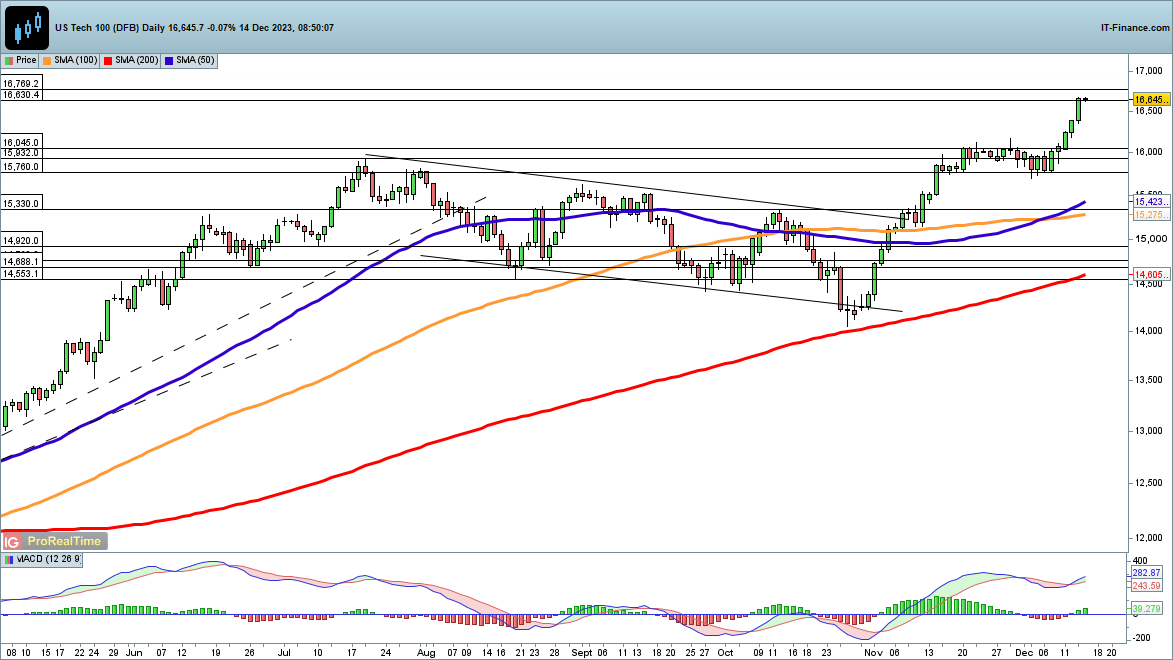
For once the Nasdaq 100 is not the one leading the charge to new highs, but it has still enjoyed an impressive bounce over the past two months.It is now targeting the record highs at 16,769, with a move above this taking it into uncharted territory. As with the Dow, the index looks overstretched in the short term, but there is little sign of a move lower at present.
Some initial weakness might target 16,000, or down to the 50-day SMA (currently 15,423).
Nasdaq 100 Daily Chart

Recommended by Nick Cawley
Top Trading Lessons
CAC40 hits new record
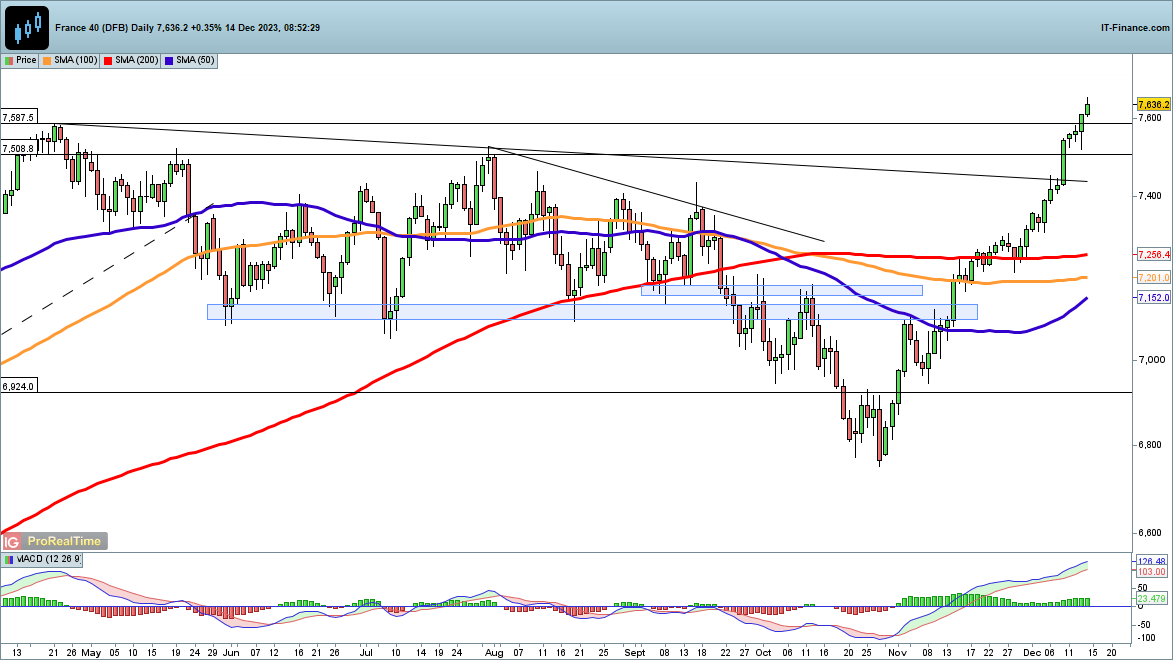
This index is pushing to new highs too, having cleared trendline resistance last week.
The buyers have seized control over the past week, with any intraday weakness being seized upon as a buying opportunity. In the event of a pullback, the 7587 and then 7525 July highs would be the initial areas to watch for support.
CAC 40 Daily Chart

element inside the
element. This is probably not what you meant to do!Load your application’s JavaScript bundle inside the element instead.
www.dailyfx.com

COMMENTS