
S&P 500, Nasdaq 100 Talking Points:Tomorrow marks the first day of Q4 trade with the October open. Both the S&P 500 and Nasdaq 100 put in
S&P 500, Nasdaq 100 Talking Points:
- Tomorrow marks the first day of Q4 trade with the October open.
- Both the S&P 500 and Nasdaq 100 put in bearish engulfing formations for September trade, with each finishing the quarter holding on to small gains.
- October can be a rough month for stocks from a seasonality perspective and there’s a major item looming over the market with a possible taper announcement from the Fed in November, just after they warned off potentially faster rate hikes than expected.
Today marks the final day of both September and Q3 and for US equites, it was a month to forget. After starting the quarter with a bang in July and August both the S&P 500 and the Nasdaq 100 gave back a portion of those gains in a brutal September.
What started as worries around Chinese property giant Evergrande deepened towards despair after the FOMC rate decision, in which the bank upgraded their rate forecast to indicate a possible hike at some point next year. And as fears around Evergrande have appeared to dissipate, those concerns around the FOMC remain and stocks are finishing September by grasping on to some near-term support.
The road ahead may continue to be bumpy: October can be a tough month for stocks, as highlighted by Christopher Vecchio’s seasonality report earlier today, and the Fed does appear to be in a tough spot in more ways than one, with Jerome Powell catching some recent heat on a couple of different accounts; for the trading activities of his staff and also being dubbed ‘a dangerous man’ by Senator Elizabeth Warren.
For the Fed: At last week’s rate decision Powell said that the bank was basically ready to taper, and provided that employment data didn’t disappoint, the bank would be making an announcement in the coming months. The jobless claims that came out this week were elevated and missed target, so there hasn’t been any great employment news yet. There’s one NFP report on the schedule before the next FOMC rate decision and that’s released next Friday (October 8th). This will be the lone NFP report that the FOMC will get to see between the September statement and the November meeting, so expect considerable attention paid to that data point, and if it does come out above expectations, there could be a risk-off move as markets begin to gear up for a taper announcement in November.
To learn more about Non-farm Payrolls, check out DailyFX Education
S&P 500
The month of September has produced a bearish engulfing formation on the monthly chart. Such setups will often be approached with the aim of bearish continuation, looking for the momentum that showed up during the candle’s formation to continue into the next bar. They don’t often show up on monthly charts, though.
Shorter-term, there’s another formation that was pointing to pullback potential and that’s a rising wedge that’s pretty much been building all year. As the Fed continued to support markets in a very clear and obvious manner, there was nary a pullback in this bullish trend. Even with inflation running at 5%+, the Fed continued to write it off as transitory and there was little reason to buck the trend.
To learn more about the rising wedge, check out DailyFX Education
More recently, however, the Fed is trying to tell markets that the tide may begin to change, even if just by a little bit, and that’s starting to create some ripple effects in both stock and bond markets.
At this point, the S&P 500 is less than 5% off of its all-time-high, set earlier in September. As I had written earlier in the month, the index could fall all the way down to the 38.2% Fibonacci retracement of the 2020-2021 trend, which would amount to a -19.84% pullback, when rounded up technically marking a ‘bear market’ – and the bullish trend would still be in working order per Fibonacci logic. Of course, that would be a move that would wipe out the entirety of 2021 gains, but if stocks did press all the way down to that spot on the chart, we’d likely hear of some interesting ideas as to how the Fed is going to shore up the matter.
To learn more about Fibonacci, check out DailyFX Education
S&P 500 Weekly Price Chart
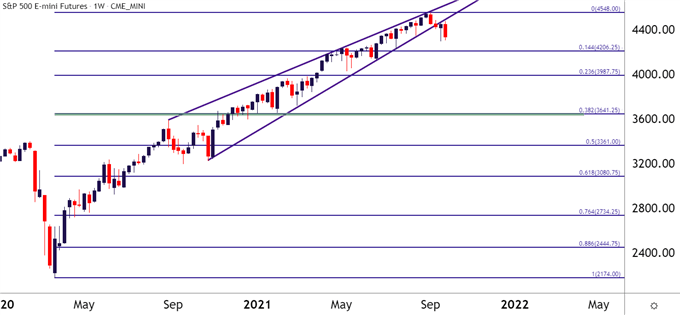
Chart prepared by James Stanley; S&P 500 on Tradingview
Nasdaq 100 Grasping for Support at the August Lows
The Nasdaq 100 also put in a bearish engulfing formation on the monthly chart in the final month of Q3. The risk to stocks may be even more magnified here, as we’ve already seen an example of rate sensitivity in the index during Q1. After the start of the New Year hope reigned supreme, and as markets geared up for recovery US rates began to run, going from a low of 91 basis points up to a high of 176 basis points on the 10 year note. As that was happening, the Nasdaq began to underperform and if we are seeing a revival of that theme, it reasons to imagine that the index may continue to be vulnerable to such forces.
To learn more about the bearish engulfing formation, check out DailyFX Education
At this point, the Nasdaq 100 is holding on to support at the August low, plotted around 14,710. Below that price is one more spot of support, taken from the July low at 14,445, which is confluent with the support side of a bullish trend channel that’s been active throughout 2021 trade. If buyers can’t hold the lows there, the next spot of support is 14k as a bigger reversal would be getting underway.
To lean more about trendlines to create channels, check out DailyFX Education
Nasdaq 100 Daily Price Chart
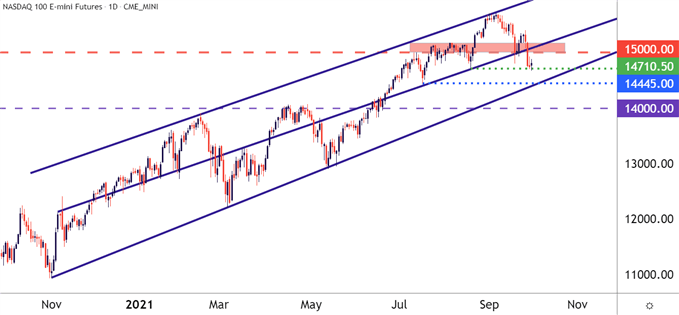
Chart prepared by James Stanley; Nasdaq 100 on Tradingview
— Written by James Stanley, Senior Strategist for DailyFX.com
Contact and follow James on Twitter: @JStanleyFX
element inside the
element. This is probably not what you meant to do!Load your application’s JavaScript bundle inside the element instead.
www.dailyfx.com