EUR/USD OUTLOOK:EUR/USD soars nearly 2.5% this week, rising to its best levels since February 2022A dovish repricing of interest rate expectations fol
EUR/USD OUTLOOK:
- EUR/USD soars nearly 2.5% this week, rising to its best levels since February 2022
- A dovish repricing of interest rate expectations following softer-than-expected U.S. inflation data may be responsible for recent moves in the FX space
- Market dynamics and positive may favor the euro in the coming week
Recommended by Diego Colman
Get Your Free EUR Forecast
Most Read: Gold Finds Spark in Weak US Inflation Data, EUR/USD Blasts Off to New 2023 Peak
EUR/USD soared this past week, rising nearly 2.5% to its best levels since February 2022 and notching its best weekly performance in approximately eight months.
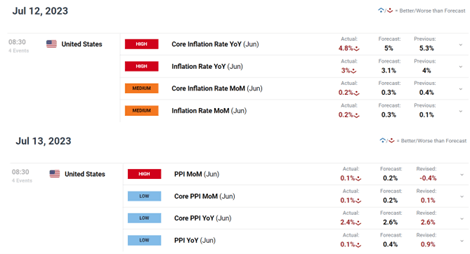
The euro’s strong rally was mainly driven by broad-based weakness in the U.S. dollar, following softer-than-expected U.S. CPI and PPI data. For context, both indicators surprised to the downside, signaling that price pressures in the North American economy are cooling faster than initially envisioned, an encouraging situation for the Federal Reserve.
PAST WEEK ECONOMIC DATA

Source: DailyFX Economic Calendar
Progress on the inflation front led markets to repriced lower the Fed’s hiking path. Although the odds of a quarter-point hike at this month’s FOMC gathering remained virtually unchanged above 90%, traders unwound bets in favor of an additional 25 basis points adjustment in September. This means the central bank could be on the verge of concluding its tightening campaign soon.
The dovish reassessment of interest rate expectations put strong downward pressure on U.S. Treasury yields, especially at the front end of the curve. To provide some color, the 2-year note was trading at its highest level in 16 years, near 5.11%, last Thursday, but late this week, it was back down to 4.74% following the latest developments.
Focusing on next week, the economic calendar will be somewhat. In the U.S., the only release of note will be the June retail sales report on Tuesday. In the Eurozone, June CPI data could get some attention, but it is unlikely to be a big source of volatility, as it will be second and final estimate, which general incorporates little revisions compared to the flash report.
Recommended by Diego Colman
How to Trade EUR/USD
INCOMING DATA IN THE US AND EU

Source: DailyFX Economic Calendar
With no major high-impact events on tap over the next several days and the Fed entering its blackout period ahead of its July 25-26 meeting, there are no significant catalysts that could cause the market narrative to shift in favor of the U.S. dollar. Against this backdrop, EUR/USD could extend its recent advance, but its upside potential may be limited given the pair’s overbought conditions in the FX space.
EUR/USD TECHNICAL ANALYSIS
EUR/USD has been on a tear in recent days, blasting past one technical resistance after another. On Friday, the pair managed to extend its advance, sustaining the last breakout to trade near 1.1237, the highest exchange rate since February 2022.
Looking ahead, if prices are able to hold above 1.1200, sentiment around the euro could improve further, reinforcing bullish appetite and paving the way for a move towards 1.1275, the 61.8% Fibonacci retracement of the Jan 2021/Sept 2022 sell-off. Above this ceiling, attention shifts to 1.1375.
On the flip side, if upward momentum fades and gives way to a market reversal, initial support is located around the 1.1200 area. If tested, the price reaction around this key floor should be closely analyzed for near-term guidance, bearing in mind that a breakdown could expose 1.1115/1.1080, followed by 1.1010.
| Change in | Longs | Shorts | OI |
| Daily | -12% | 9% | 3% |
| Weekly | -36% | 36% | 9% |
EUR/USD TECHNICAL CHART

EUR/USD Technical Chart Creating Using TradingView
element inside the
element. This is probably not what you meant to do!Load your application’s JavaScript bundle inside the element instead.
www.dailyfx.com
