
Yesterday’s Market Wrap
In yesterday’s market wrap, the Asian session brought attention to upcoming survey data from Australia, including the Westpac Consumer Confidence and the National Australian Bank’s Business Confidence. After a cautious start, Wall Street closed in positive territory, with the Dow Jones gaining 0.62% and the Nasdaq climbing 0.18%.
Meanwhile, crude oil prices experienced a slight drop of less than 1%, while gold remained flat at around $1,925 per ounce. Investors are now turning their attention to the start of the Q2 earnings season, which will provide valuable insights into corporate performance.
China’s inflation data came in lower than expected, with the Consumer Price Index (CPI) remaining flat in June instead of the anticipated 0.2% increase.
Additionally, the Producer Price Index (PPI) dropped to -5.4% YoY, falling below the -5% forecast. These deflationary indicators have further opened the door for potential stimulus measures, including both monetary and fiscal policies.
Today’s Market Expectations
Today’s market expectations include several key economic indicators from different countries. In Germany, the final Consumer Price Index (CPI) for the month will be released, providing insight into the inflationary pressures in the country. The UK will announce the Claimant Count Change, which measures the number of people claiming unemployment-related benefits.
Additionally, the Average Earnings Index, a crucial indicator of wage growth, will be revealed, along with the Unemployment Rate. Japan will share the Preliminary Machine Tool Orders, which indicates the demand for machinery in the manufacturing sector.
In Italy, the Industrial Production figure will be published, reflecting the monthly change in output from the manufacturing, mining, and utilities sectors.
Furthermore, the ZEW Economic Sentiment reports for Germany and the broader Eurozone will indicate the business and investor sentiment in these regions. Market participants anticipate these data releases as they offer insights into the economic health of these countries and can influence market sentiment and trading decisions.
Yesterday’s market presented a mixed picture of slow price action combined with moments of heightened volatility, particularly during the release of the US economic data.
In the latest update, our USD/JPY trade ended up hitting the stop loss level, resulting in a loss. On the other hand, our AUD/USD and Gold (long-term signal) trades performed well and closed at the take profit level, generating profits.
GOLD Breaking Above $1,930
In order to manage risk, we have set the stop loss at $1913.64. On the upside, the take profit level is set at $1935.64.
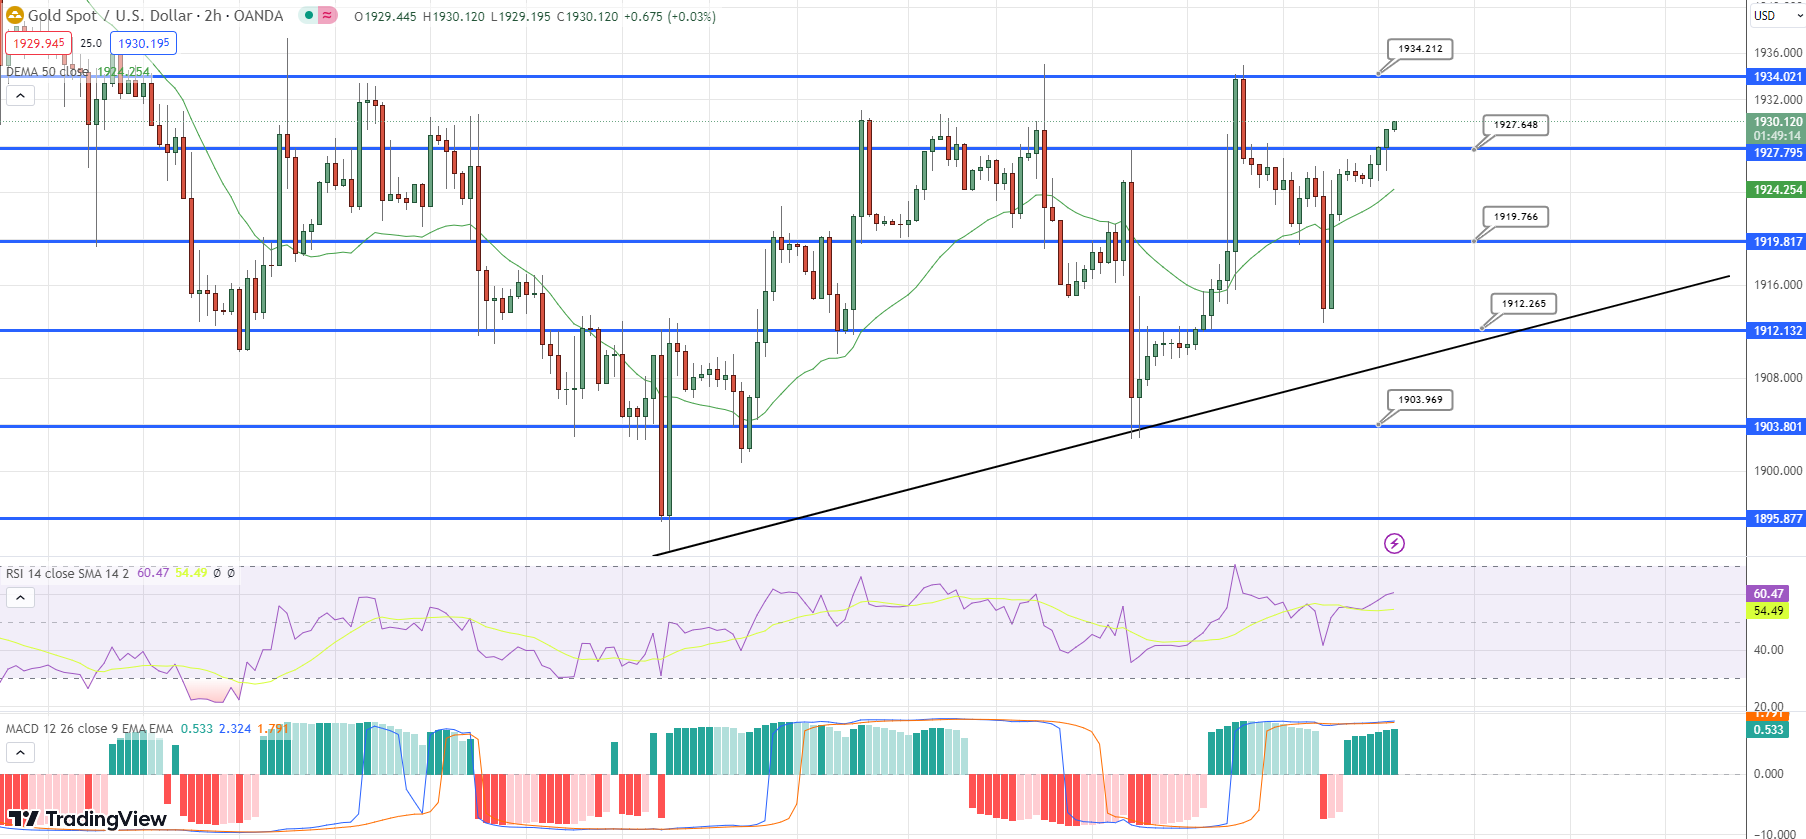
XAU/USD – 240 minute chart
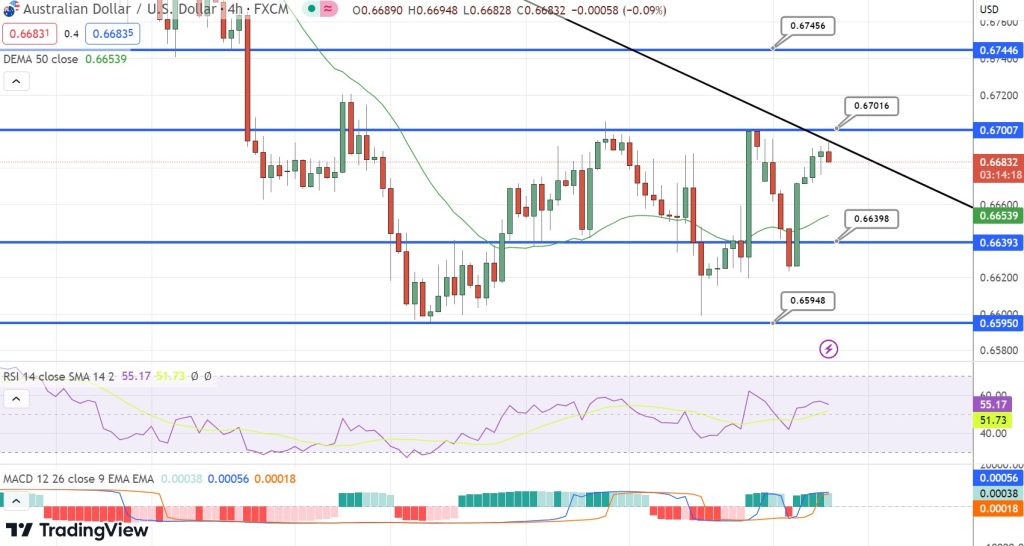
AUD/USD Double Top Resistance Near 0.6699
The AUD/USD currency pair is currently showing signs of a potential decline as it faces resistance from a downward trendline around the $0.6700 level, as indicated on the chart.
Based on our analysis, we have a sell signal for AUD/USD with an entry price set at 0.6683. To manage risk, we have placed the stop loss at 0.6729. On the downside, the take profit level is set at 0.6659.
Cryptocurrency Update
BITCOIN Remains Within the Range
BTC/USD – 240 minute chart
Will the 100 Daily SMA Hold As Support for ETHEREUM?
Ethereum’s technical outlook remains the same ever since it has exhibited a notable surge in the cryptocurrency market, particularly for the ETH/USD pair, as it surpassed the $1,900 threshold. However, the price failed to reach our predefined take-profit target and began retracing its gains.
Following a period of consolidation, the price started to experience a decline. Initially, the 50-day Simple Moving Average (SMA) acted as a support level, but eventually, it was breached.
Fortunately, the decline found support at the 200-day SMA, leading to a rebound above all moving averages. Currently, we are observing a pullback, and it remains to be seen if the 100 SMA will hold as a viable support level.
ETH/USD – Daily chart
www.fxleaders.com