Article by IG Chief Market Analyst Chris Beauchamp Recommended by IG The Fundamentals of Range Trading FTSE 100, Dow Jo
Article by IG Chief Market Analyst Chris Beauchamp
Recommended by IG
The Fundamentals of Range Trading
FTSE 100, Dow Jones, Nasdaq 100 Analysis and Charts
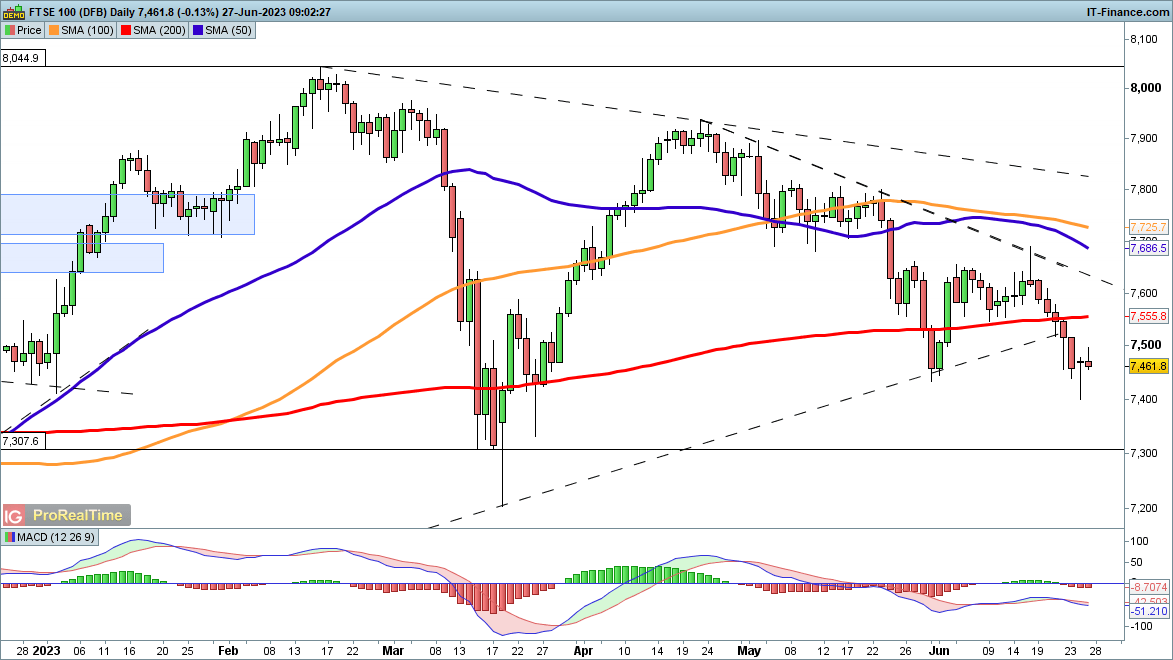
FTSE 100 rebound hits a wall
After rebounding from 7400 yesterday, the index has pushed higher and could be forming a low.Further gains above 7500 would reinforce this view, and put the price on course to target the 200-day simple moving average (SMA), and then to trendline resistance from the April highs, likely to come into play around 7600. Beyond this lies 7650, which marked the highs of late May and early June.
A reversal back below 7450 would mark a bearish development and could see the price head back to 7400 or lower.
FTSE 100 Daily Price Chart

Trade Smarter – Sign up for the DailyFX Newsletter
Receive timely and compelling market commentary from the DailyFX team
Subscribe to Newsletter
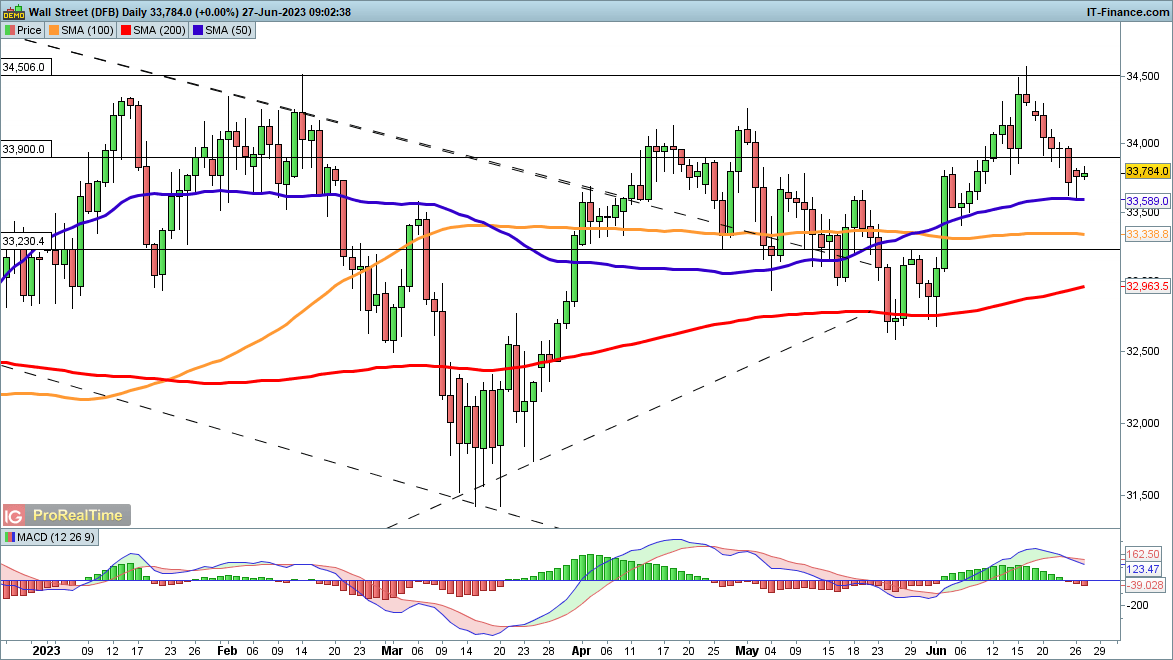
Dow bounce stalls
The price rallied off the 50-day SMA yesterday, but has failed to see much follow-through in early trading this morning.It would need a move above 33,900 to bolster the view that a low is in, and this might then allow the price to contemplate a move back to 34,500. Beyond this, the price will target the December 2022 high of 34,940.
A drop back below the 50-day SMA would be a fresh bearish development and open the way to the 100-day SMA and even eventually the 200-day SMA.
Dow Jones Daily Price Chart

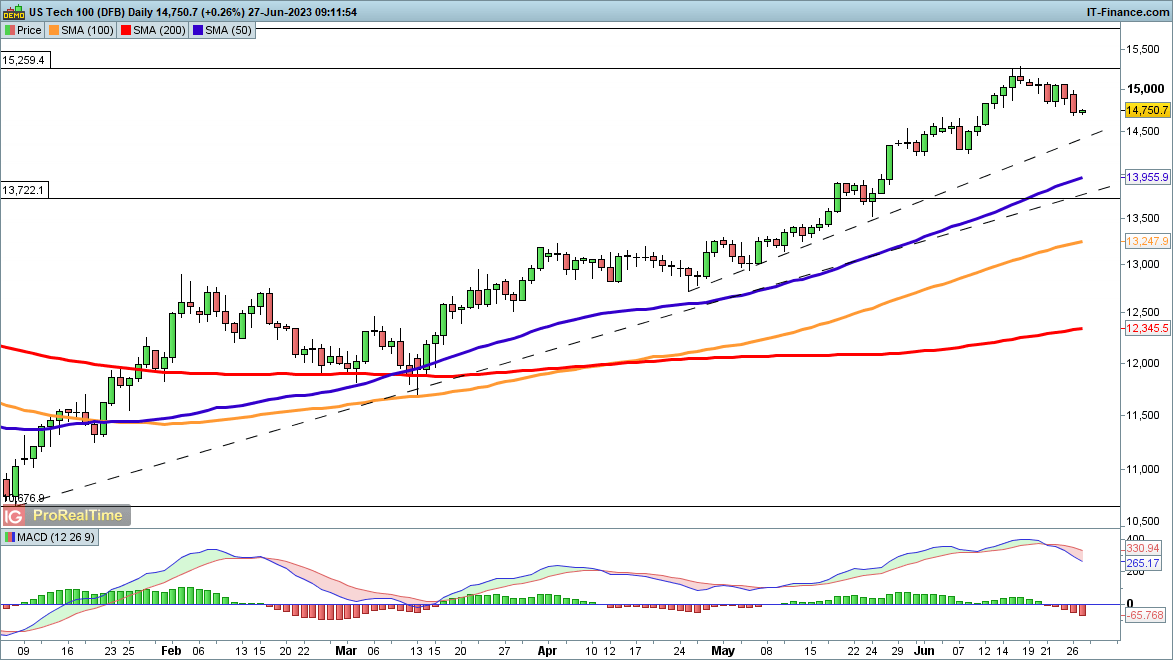
Nasdaq 100 edges higher after Monday’s drop
Another day of losses took the index to its lowest level in two weeks.The uptrend remains intact and would need to drop towards 14,500 to test trendline support from late April. If this is lost then the 50-day SMA could become support, and then below this trendline support from December would come into play.
A revival above 14,900 might suggest that a higher low has been formed, though the price still remains overextended in the short term.
Nasdaq 100 Daily Price Chart

element inside the
element. This is probably not what you meant to do!Load your application’s JavaScript bundle inside the element instead.
www.dailyfx.com
