Major Indices Update:FTSE 100 drops on AstraZeneca disappointmentDow trades close to record highsNikkei 225 scales new 34-year high Recommended by
Major Indices Update:
- FTSE 100 drops on AstraZeneca disappointment
- Dow trades close to record highs
- Nikkei 225 scales new 34-year high
Recommended by Axel Rudolph
Get Your Free Equities Forecast
FTSE 100 drops on AstraZeneca disappointment
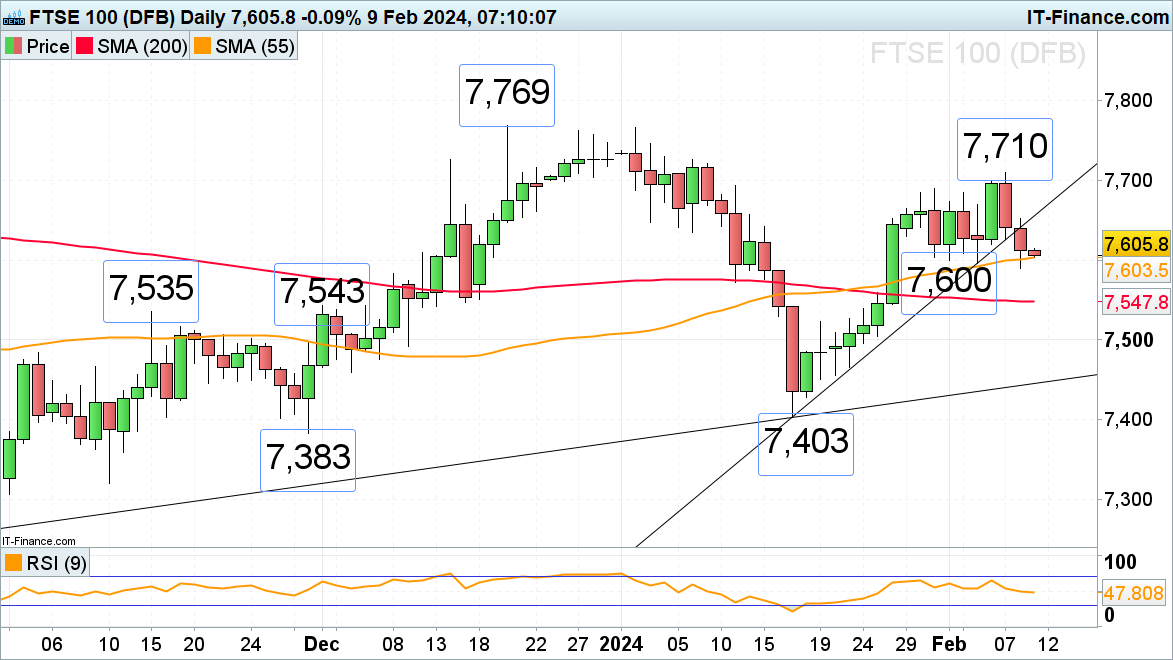
The FTSE 100 has been rapidly declining from this week’s 7,710 Wednesday high amid disappointing UK company earnings with AstraZeneca on Thursday wiping off around 40 points on the FTSE 100 and the index slipping to the 55-day simple moving average (SMA) at 7,603 and Thursday’s 7,590 low.
A tumble through 7,590 would push the 200-day SMA at 7,548 to the fore, together with the mid-November and early December highs at 7,543 to 7,535.
Minor resistance sits at Wednesday’s 7,626 low.
FTSE 100 Daily Chart

Source: ProRealTime, Prepared by Axel Rudolph
Dow trades close to record highs
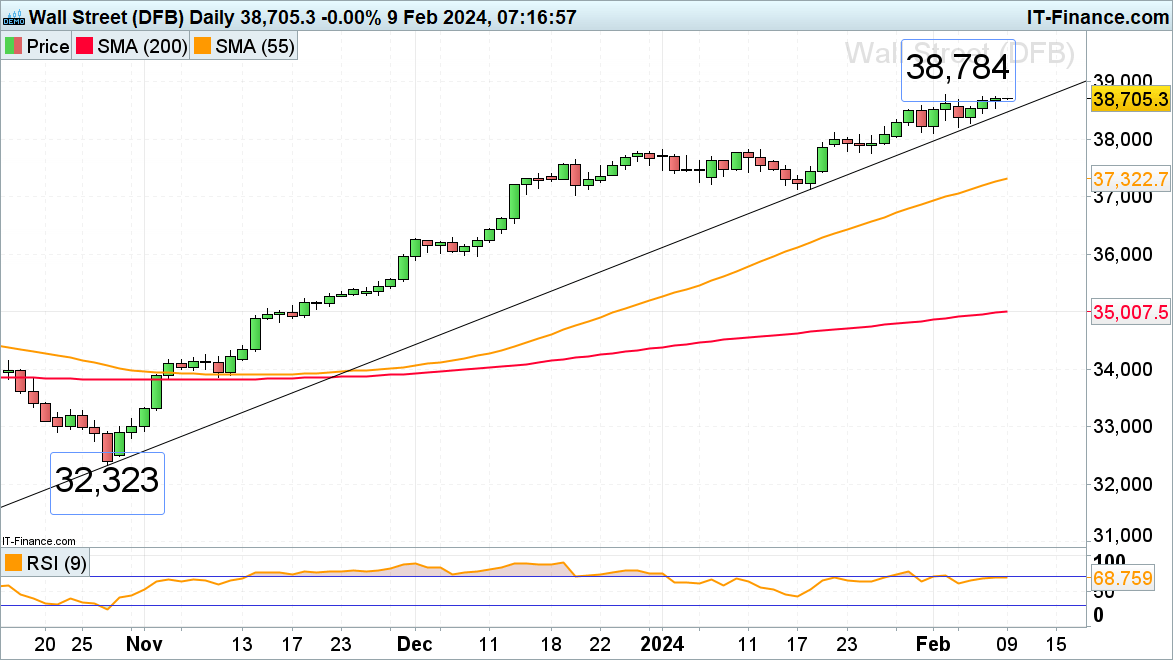
The Dow Jones Industrial Average, unlike its peers like the Nasdaq 100 and the S&P 500, hasn’t managed to make a new record high this week as yet but
continues to grind higher towards the 38,800 region ahead of the major psychological 40,000 mark as the US economy and employment remain strong.
In case of a retracement being seen, the 31 January high at 38,583 and the October to February uptrend line at 38,470 may be revisited. While no fall through the second to last daily reaction low at the 1 February at 38,105 is seen, the medium-term uptrend remains intact.
Dow Jones Daily Chart

Source: ProRealTime, Prepared by Axel Rudolph
| Change in | Longs | Shorts | OI |
| Daily | -4% | 2% | 1% |
| Weekly | 3% | -1% | 0% |
The Nikkei 225 scales new 34-year high
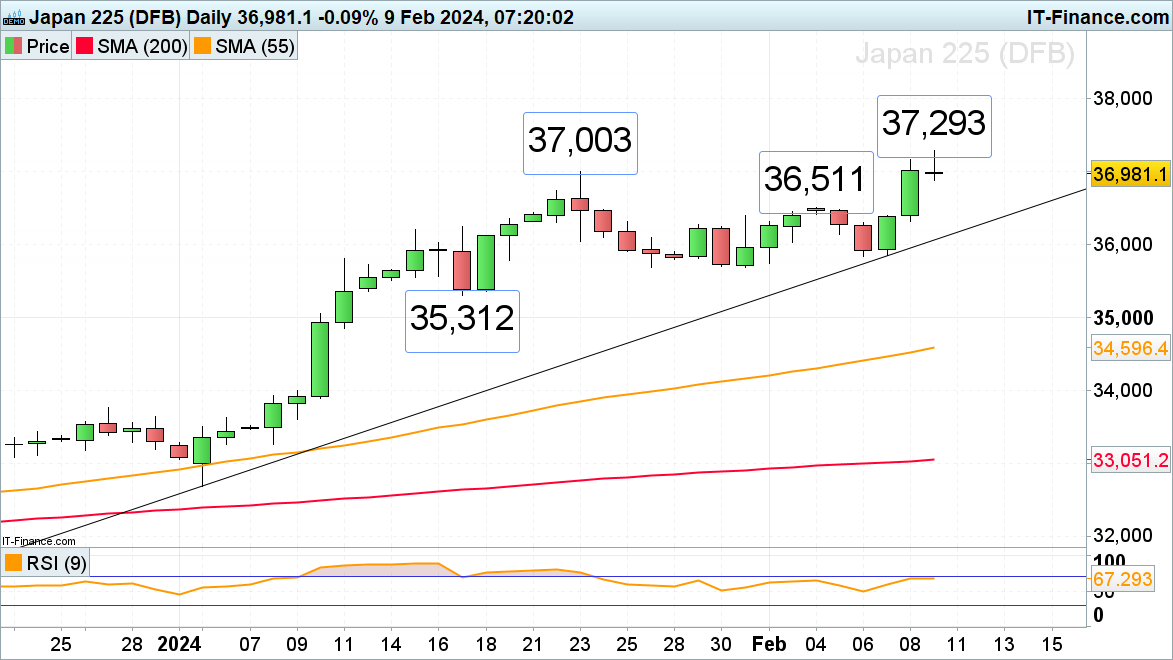
The Nikkei 225 has resumed its ascent and has risen to a new 34-year high at 37,293, a rise above which would put the psychological 40,000 mark on the cards.
First, though, the January peak at 37,003 would need to be once again exceeded on a daily chart closing basis.
Were a retracement lower to be seen, however, last week’s high at 36,511 should act as at least interim support.
Nikkei 225 Daily Chart

Source: ProRealTime, Prepared by Axel Rudolph
Trade Smarter – Sign up for the DailyFX Newsletter
Receive timely and compelling market commentary from the DailyFX team
Subscribe to Newsletter
element inside the
element. This is probably not what you meant to do!Load your application’s JavaScript bundle inside the element instead.
www.dailyfx.com

COMMENTS