
GBP, USD Talking Points:GBP/USD pressurized by safe-haven DollarCable prices threaten key psychological level of 1.3000 triangle formationRussia Ukra
GBP, USD Talking Points:
- GBP/USD pressurized by safe-haven Dollar
- Cable prices threaten key psychological level of 1.3000 triangle formation
- Russia Ukraine developments remain as a key driver of price action
GBP/USD Technical Levels
GBP/USD is currently trading just above the key psychological level of 1.3000 as heightened volatility and an uncertain geopolitical environment continues to drive price action.
Although fundamental developments remain at the forefront of risk sentiment, Fibonacci levels from historical moves (2007 – 2009 & 2018 – 2020 move) have provided additional layers of support and resistance, forming zones of confluency which may continue to hold both bulls and bears at bay.
As prices continue to trade below both the 50 and 200-day MA (moving average), the CCI (commodity channel index) remains in negative territory suggesting that although the pair may be considered oversold, the downward trajectory currently remains as the prominent force.
GBP/USD Daily Chart
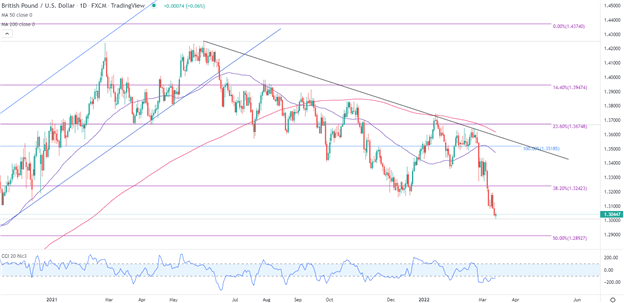
Chart prepared by Tammy Da Costa using TradingView
GBP/USD Major Risk Events
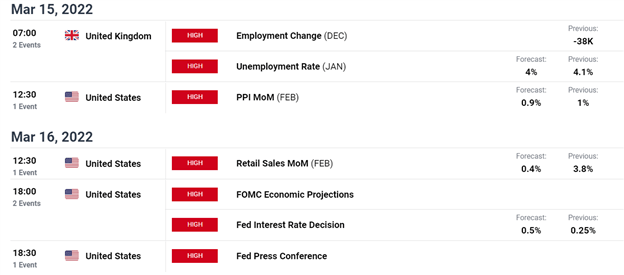
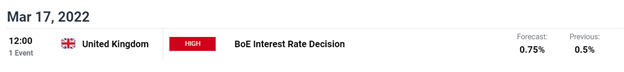
Meanwhile, on the economic docket, a series of major risk event continues to loom, with central banks under pressure to find price stability in an environment which has seen prices consistently surge since last year.
With investors expecting the BoE (Bank of England) and the Fed (Federal Reserve) to hike rates this week, in an effort to tame inflation, the conflict between Russia and Ukraine remains the primary driver of price action, at least for now.
GBP/USD Key Support & Resistance
Support:
- S1: 1.289 (50% Fibonacci level of 2018 – 2020 move)
- S2: 1.250
- S3: 1.211
Resistance
R1: 1.324 (38.2% Fibonacci level of 2018 – 2020 move)
R2: 1.351 (2009 Low)
R2: 1.368
— Written by Tammy Da Costa, Analyst for DailyFX.com
Contact and follow Tammy on Twitter: @Tams707
element inside the
element. This is probably not what you meant to do!Load your application’s JavaScript bundle inside the element instead.
www.dailyfx.com