
Gold Technical Price Forecast: NeutralGold prices snapped a six-week winning streak into resistance at the record highs with XAU/USD down nearly 3%
Gold Technical Price Forecast: Neutral
Gold prices snapped a six-week winning streak into resistance at the record highs with XAU/USD down nearly 3% ahead of the New York close on Friday. Despite the losses, gold is set to close well-above the weekly lows and while our broader outlook is constructive, prices may continue to see some sideways price action and we’re on the lookout for a low in the weeks ahead. Review my latest Weekly Strategy Webinarfor an in-depth breakdown of thisgold technical setup and more.
Gold Price Chart – XAU/USD Weekly
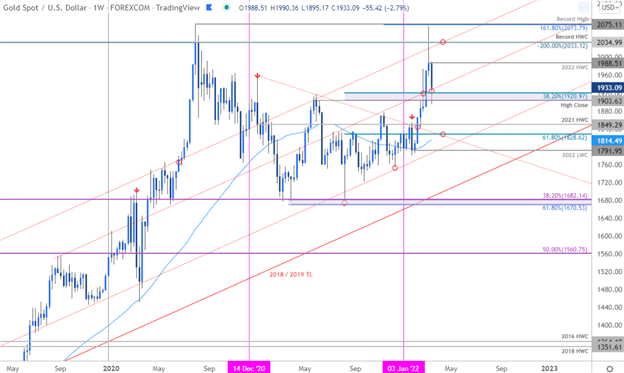
Chart Prepared by Michael Boutros, Technical Strategist; Gold on Tradingview
Notes: In my last Gold Weekly PriceOutlook we noted that a breakout had, “cleared key resistance targets and keeps the broader focus higher in XAU/USD.” The focus was resistance targets into the 1.618% extension of the August 2021 advance / record high at 2073/75 with a close above the record high-week close at 2034 needed to keep the immediate rally viable. Gold registered an intraweek high at 2070 last week before reversing with XAU/USD unable to mark a weekly close above 2034.
This week’s exhaustion pullback dropped (and briefly probed below) key weekly support at the May high-close / 38.2% retracement of the August rally at 1903/20– we’re looking for possible inflection off this zone. A break lower would threaten a much steeper correction with such a scenario risking a drop towards the 2021 high-week close at 1849 and broader bullish invalidation at the 61.8% Fibonacci retracement at 1828. Initial resistance now back at the yearly high-week close at 1988 – a breach / close above this threshold is needed to mark resumption back towards 2034 and critical resistance at 2073/75.
Bottom line: Gold has exhausted into key resistance around the record highs – risk for some more consolidation here before the next break higher. From a trading standpoint, losses should be limited to this week’s lows IF price is indeed heading higher on this stretch with a close above 1988 needed to fuel the next attempt at record highs. A break lower from here, could see another accelerated sell-off but we would still be looking for a possible exhaustion low ahead of 1828. Review my latest Gold Price Outlook for a closer look at the near-term XAU/USD technical trade levels.
For a complete breakdown of Michael’s trading strategy, review his Foundations of Technical Analysis series on Building a Trading Strategy
Gold Trader Sentiment – XAU/USD Price Chart
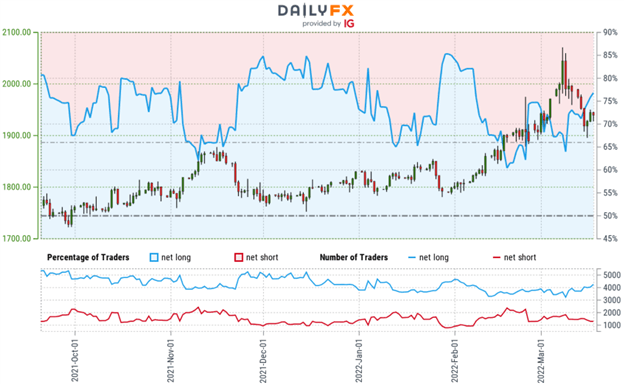
- A summary of IG Client Sentiment shows traders are net-long Gold- the ratio stands at +3.13 (75.76% of traders are long) – typically bearishreading
- Long positions are2.52% lower than yesterday and 3.55% higher from last week
- Short positions are 14.44% higher than yesterday and 10.62% lower from last week
- We typically take a contrarian view to crowd sentiment, and the fact traders are net-long suggests Gold prices may continue to fall. Traders are less net-long than yesterday but more net-long from last week. The combination of current positioning and recent changes gives us a further mixed Gold trading bias from a sentiment standpoint.
—
Previous Weekly Technical Charts
– Written by Michael Boutros, Technical Strategist with DailyFX
Follow Michael on Twitter @MBForex
element inside the
element. This is probably not what you meant to do!Load your application’s JavaScript bundle inside the element instead.
www.dailyfx.com