
Gold Price (XAU/USD), Chart, and AnalysisUS Treasury yields remain near multi-year highs.The longer-term gold chart looks negative.Retail clients are
Gold Price (XAU/USD), Chart, and Analysis
- US Treasury yields remain near multi-year highs.
- The longer-term gold chart looks negative.
- Retail clients are long of gold and that’s a bearish contrarian signal.
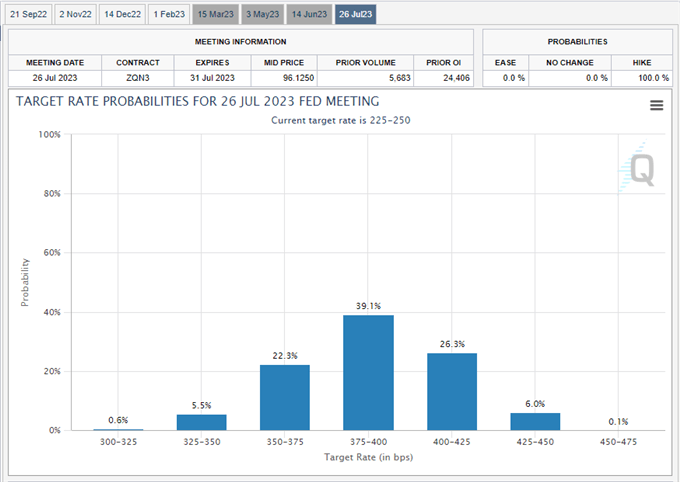
Gold is set to print its fifth straight monthly loss and re-test the $1,700/oz. level for the first time in nearly six weeks as sellers remain in complete control of the precious metal. The latest leg lower comes courtesy of a hawkish Fed last week whose chair and board members reiterated the central bank’s message that interest rates will continue to be hiked in the fight against inflation. Financial markets are currently in a 70% chance that the central bank will raise interest rates by 75 basis points at the September 22 meeting. Interest rates in the US are expected to be hiked further over the coming to 3.75% – 4.00% by the middle of 2023, compared to a current rate of 2.25% – 2.50%.
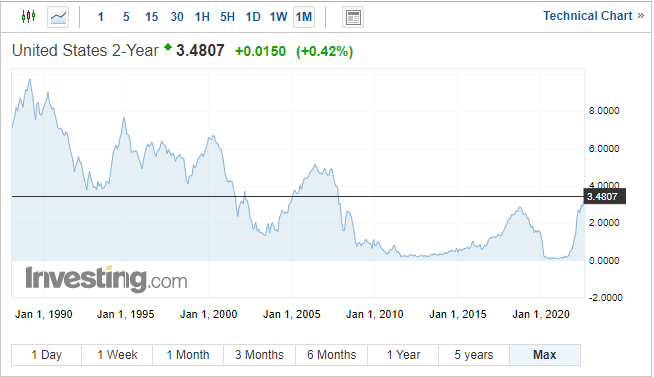
This relentless rise in short-term rates over the next year has pushed short-dated US Treasury yields to highs not seen since the end of 2007. The re-pricing of US interest rate expectations over the last few months has weighed heavily on gold and will continue to do so for the foreseeable future.
For all market-moving data releases and events, see the DailyFX Economic Calendar.
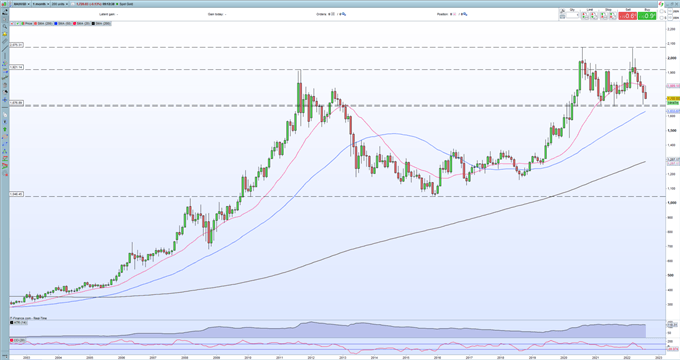
The monthly gold chart shows the precious metal nearing a prior zone of support between $1,707/oz. and $1,668/oz. and this zone looks likely to be tested in the coming weeks. Gold is now trading below the short-term moving average (red line), and while the CCI indicator is in oversold territory it is not yet at the extreme levels seen at other multi-month lows. This indicator does suggest however that the market may need a certain amount of time to settle before the next move lower.
Gold Monthly Price Chart – August 31, 2022
Retail trader data show 82.46% of traders are net-long with the ratio of traders long to short at 4.70 to 1. The number of traders net-long is 5.62% higher than yesterday and 3.24% higher from last week, while the number of traders net-short is 7.88% lower than yesterday and 5.17% lower from last week.
We typically take a contrarian view to crowd sentiment, and the fact traders are net-long suggests Gold prices may continue to fall. Traders are further net-long than yesterday and last week, and the combination of current sentiment and recent changes gives us a stronger Gold-bearish contrarian trading bias.
What is your view on Gold – bullish or bearish?? You can let us know via the form at the end of this piece or you can contact the author via Twitter @nickcawley1.
element inside the
element. This is probably not what you meant to do!Load your application’s JavaScript bundle inside the element instead.
www.dailyfx.com