GOLD AND S&P 500 OUTLOOK:Gold prices bounce back after a small drop in the previous trading sessionS&P 500 notches a small loss, but finishes
GOLD AND S&P 500 OUTLOOK:
- Gold prices bounce back after a small drop in the previous trading session
- S&P 500 notches a small loss, but finishes the session off its worst levels
- This article looks at key S&P 500 levels to watch in the coming days
Recommended by Diego Colman
Get Your Free Gold Forecast
Most Read: Euro Forecast – EUR/USD Rebounds as Trendline Support Holds Bears at Bay. What Now?
Gold prices (XAU/USD) recovered on Thursday following a small pullback in the previous day, up 0.5% to $2,015 in late afternoon trading, underpinned by falling U.S. government bond rates, with the 10-year yield down about 5 basis points to 3.54% and coming within striking distance from breaking below its 200-day simple moving average. With this gain, XAU/USD has risen 1.5% in April, after a solid 8% rally in March.
The U.S. Treasury curve shifted downwards sharply after U.S. macroeconomic data, such as jobless claims and existing home sales, disappointed consensus estimates, reinforcing the view that the U.S. economy continues to soften and could head into a painful downturn in the coming quarters. Although the outlook remains fluid, downside risks have certainly risen lately.
The increased likelihood of a recession, which tends to be deflationary, is likely to lead the Fed to wrap up its tightening campaign sooner rather than later to prevent economic scarring. Once the FOMC hits the stop button, rates usually start to retreat quickly, as traders attempt to front-run the subsequent easing cycle. This scenario should be bullish for precious metals.
The policy-pivot narrative regained traction on Thursday after ultra-hawk Federal Reserve Bank of Cleveland President Loretta Mester signaled support for another hike, while simultaneously acknowledging that the bank is getting closer to the end of its tightening journey. This could mean one last 25 bps hike at the May FOMC meeting, followed by a pause.
Meanwhile, the S&P 500 posted moderate losses, down 0.6% to 4,130, despite the beneficial move in yields, with bulls failing to overcome selling pressure at every opportunity, amid growing concerns about corporate earnings. While some companies have managed to post constructive results, big names such as Netflix and Tesla have disappointed expectations, reinforcing headwinds for the tech space.
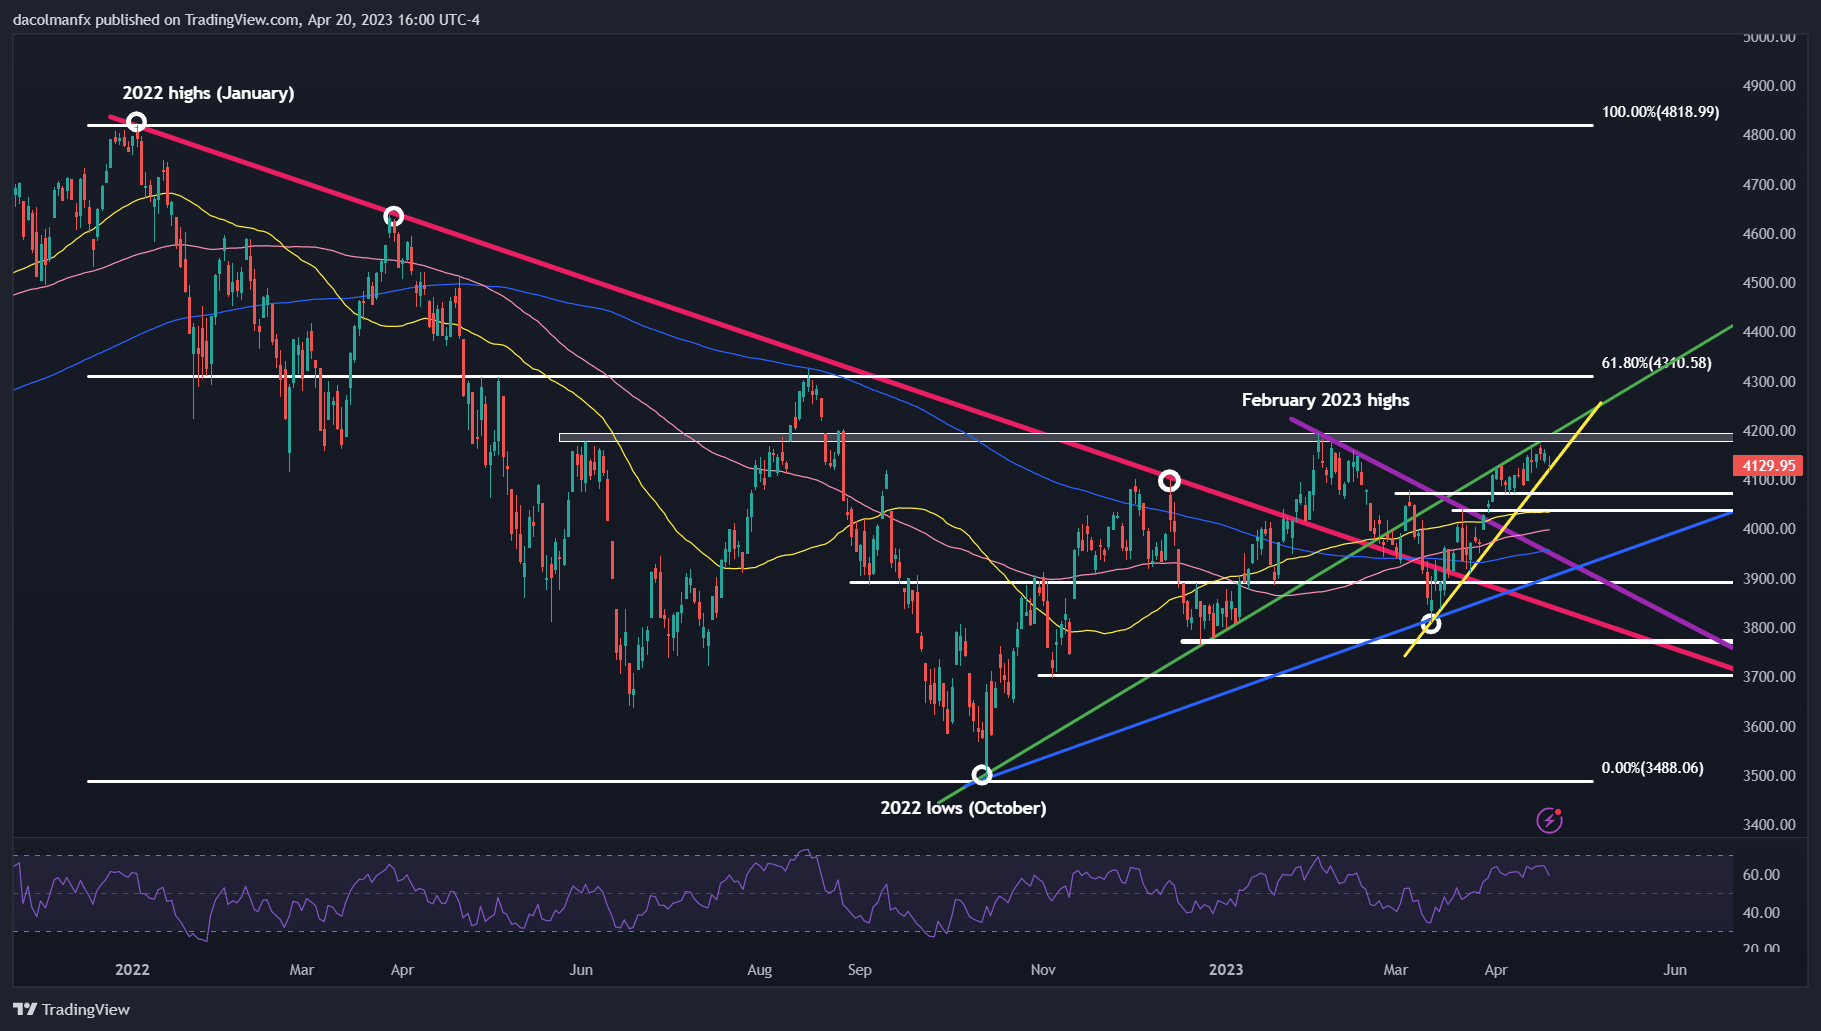
From a technical standpoint, the S&P 500 has been stuck between two trendlines, as shown in the chart below, with the upper one (green) acting as resistance and the lower one (yellow) behaving as support. After Thursday’s pullback, the index appears to be about to test trendline support at 4,100. If this floor is taken out, we could see a slide towards 4,075, followed by 4,035.
On the other hand, if bulls manage to defend current levels and trigger a turnaround, initial resistance stretches from 4,175 to 4,200. In the event of a bullish breakout, buying interest could accelerate in the coming days, setting the stage for a move towards 4,310, a key ceiling defined by the 61.8% Fibonacci retracement of the 2022 sell-off.
Recommended by Diego Colman
Get Your Free Equities Forecast
S&P 500 TECHNICAL ANALYSIS

S&P 500 Technical Chart Prepared Using TradingView
element inside the
element. This is probably not what you meant to do!Load your application’s JavaScript bundle inside the element instead.
www.dailyfx.com
