GOLD PRICE FORECAST:Gold prices gain after encountering support at the lower limit of a medium-term rising channelGains are modest as traders remain r
GOLD PRICE FORECAST:
- Gold prices gain after encountering support at the lower limit of a medium-term rising channel
- Gains are modest as traders remain reluctant to take large directional positions ahead of key U.S. economic data later this week
- The U.S. labor market report for May will steal the limelight on Friday
Recommended by Diego Colman
Get Your Free Gold Forecast
Most Read: Crude Oil Prices in Tailspin amid Demand Worries and OPEC+ Infighting
Gold prices rose on Wednesday, but gains were limited amid disparate economic data, with traders reluctant to take large directional positions ahead of the U.S. nonfarm payrolls survey. In this context, XAU/USD was up 0.3% to $1,965 in early afternoon trading, extending its recovery after bouncing off channel support earlier this week.
The lack of a strong market bias in the session was attributed to mixed U.S. macro reports. On the one hand, the Chicago Business Barometer for May fell way more than expected and contracted for the ninth consecutive month, sinking to 40.4 from 48.6 previously, the largest single-period drop since the Covid-19 close in 2020.
Disappointing regional PMI figures, however, were offset by solid labor market results. According to BLS, job openings surged in April, rising to 10.103 million versus a forecast of 9.375 million, a sign that the Fed has more work to do to slow hiring in the economy as part of its fight to bring inflation down to the 2.0% target.
US DATA AT A GLANCE

Source: DailyFX Economic Calendar
Recommended by Diego Colman
How to Trade Gold
Related: Gold Prices at Risk of Deeper Correction on Surging Real Yields, USD Strength
Looking ahead, gold’s near-term prospects are likely to depend on the Federal Reserve’s monetary policy path. A few weeks ago, traders were convinced that the central bank would hit the pause button at its next gathering, but expectations have since shifted in a more hawkish direction, with swaps assigning a 65% probability to a quarter-point hike.
The Fed has indicated that it is not on a pre-set course and will embrace a data-dependent approach. This means that its next move is not yet locked or a done deal and could change depending on incoming information between now and the June FOMC meeting. For this reason, the latest U.S. employment survey, to be released on Friday, will be critical for markets.
In terms of estimates, the U.S. economy is forecast to have created 190,000 jobs in May after having added 253,000 positions in April. With this result, the unemployment rate is seen ticking up to 3.5% from 3.4% previously.

Source: DailyFX Economic Calendar
If hiring remains sturdy and surprises to the upside, as it has time and again this year, policymakers will be reluctant to suspend their tightening campaign and could continue raising borrowing costs heading into the summer. A robust labor market would also imply higher-for-longer rates. This scenario would undermine precious metals, setting the stage for a deeper pullback in gold prices.
| Change in | Longs | Shorts | OI |
| Daily | 2% | -8% | -1% |
| Weekly | 6% | -8% | 1% |
GOLD TECHNICAL ANALYSIS
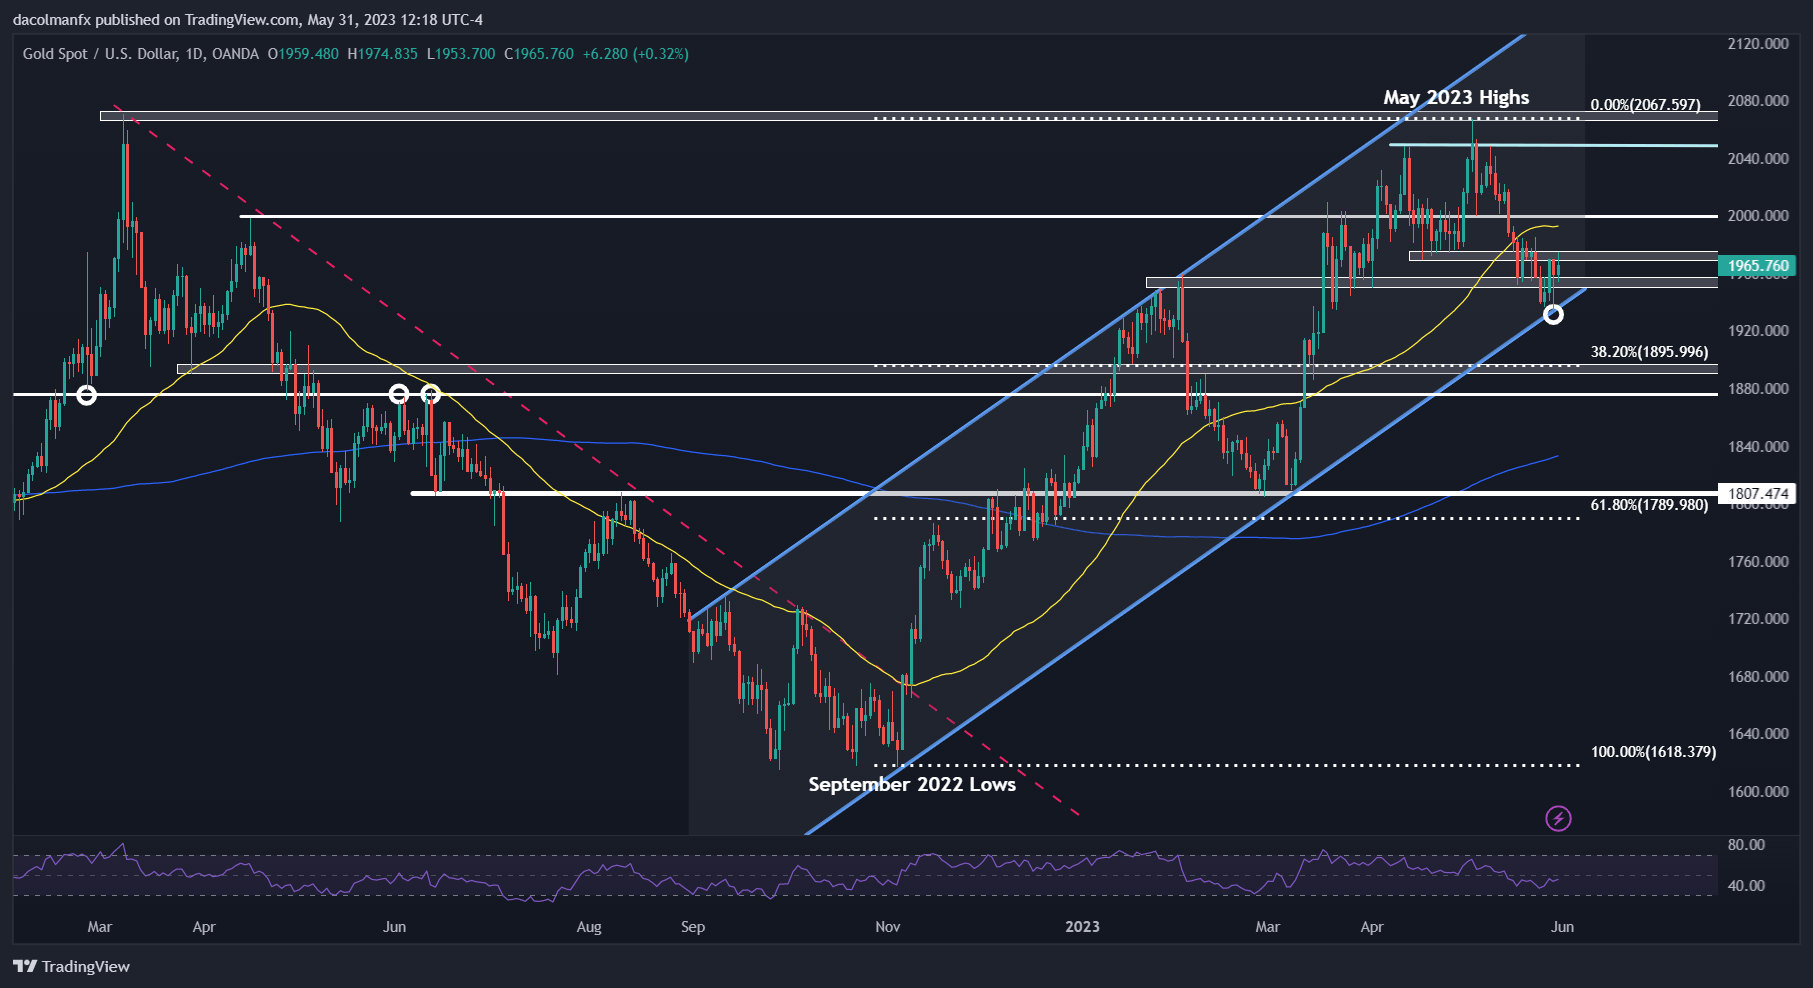
Gold fell earlier this week, but found support at the lower boundary of a rising channel before bouncing from that technical zone on Wednesday, with prices approaching resistance near $1,975 at the time of writing. Upside clearance of this ceiling is required to rejuvenate bullish impetus and have a strong chance of recapturing the psychological $2,000 level soon.
On the flip side, if sellers regain control of the market and spark a bearish reversal, initial support appears at $1,950, followed by $1,935. On further weakness, we could see a slump toward $1,895, the 38.2% Fibonacci retracement of the Sept 2022/May 2023 rally.
GOLD PRICES TECHNICAL CHART

Gold Prices Chart Prepared Using TradingView
element inside the
element. This is probably not what you meant to do!Load your application’s JavaScript bundle inside the element instead.
www.dailyfx.com